
CoffeeScript Debugging with Sourcemaps in WebStorm 6

Sourcemaps help to solve the problems in the JavaScript ecosystem introduced with JS minification and transpiling from other languages (e.g., CoffeeScript and TypeScript):
- Sourcemaps allow you to navigate between minified JavaScript files and the original JavaScript files before they were minified.
- Sourcemaps allow you to navigate between languages that compile to JavaScript (CoffeeScript, TypeScript, etc.) and the JavaScript files that are output in the compilation process.
WebStorm 6 and PhpStorm 6 can now leverage the information provided by sourcemaps and use it to debug JavaScript files. For example, you can place breakpoints in a CoffeeScript file and the debugger will pause at the breakpoint and display the relevant information from that line (variables in context, etc.).
Users of other JetBrains IDEs (RubyMine, PyCharm, IntelliJ IDEA, …) will need to download and install the File Watchers plugin to use this functionality (available for free).
To debug a CoffeeScript File:
1. Install CoffeeScriptRedux (Redux is still in beta, but it is *required* for generated sourcemaps for debugging. As it nears release, we’ll improve support and make this process much smoother with much less configuration)
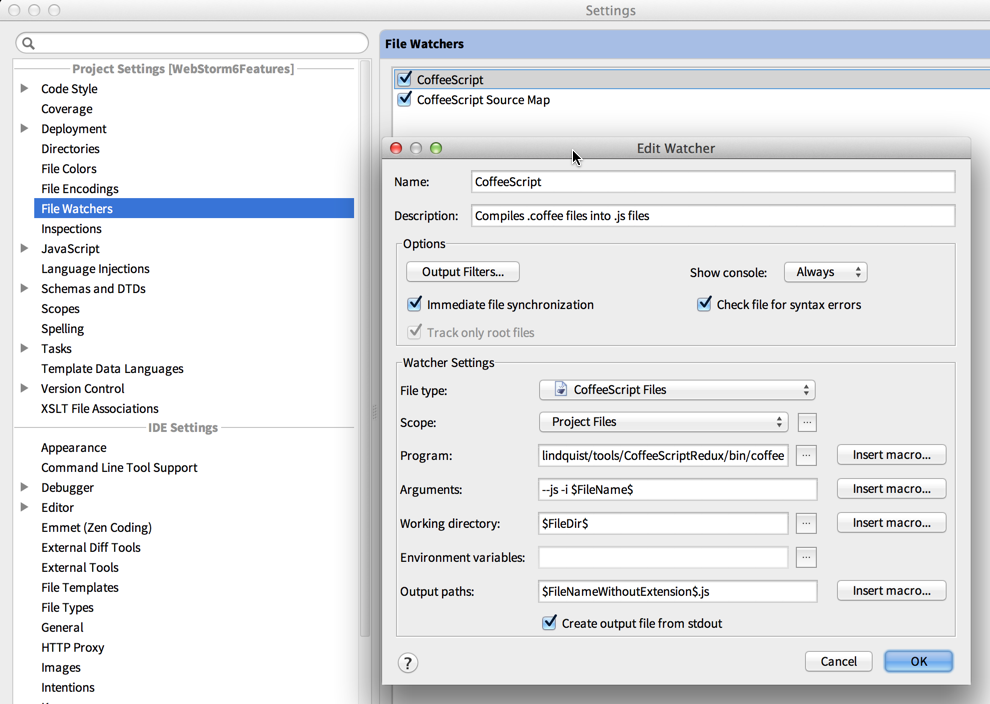
2. Set up a CoffeeScript file watcher using Redux (this is a bit different from the default template which uses the non-Redux version of the CoffeeScript compiler, so follow this screenshot carefully):
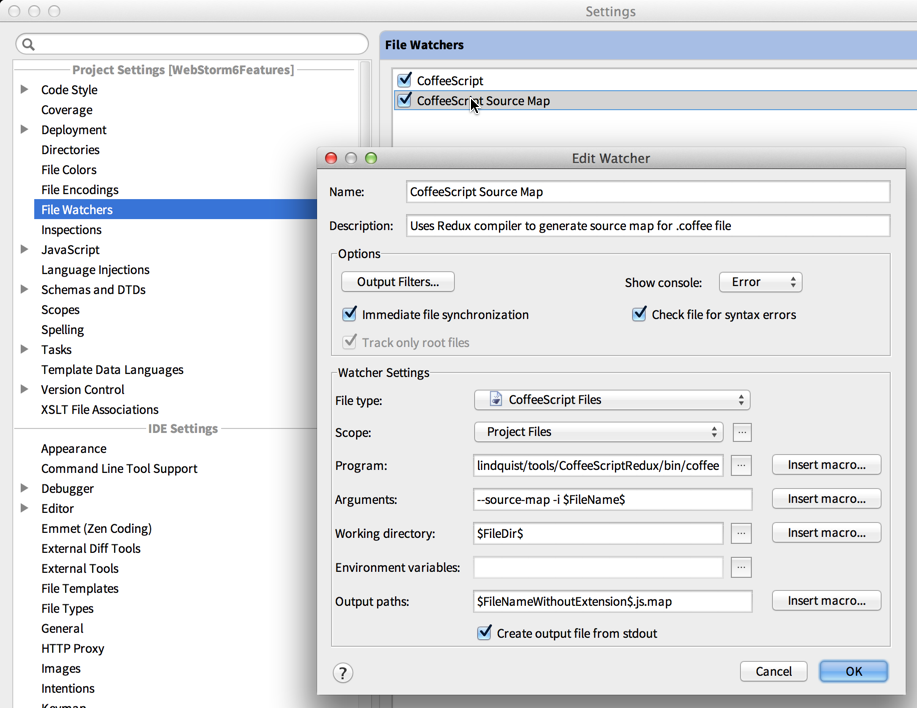
3. Set up a CoffeeScript Sourcemap Compiler watcher:
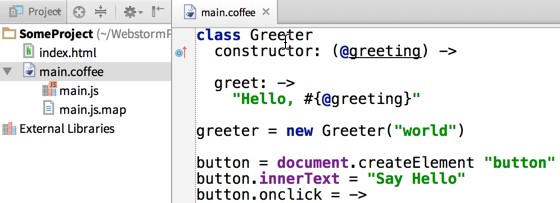
Now, when you make changes in a CoffeeScript file, both watchers will be triggered and will generate target JavaScript file and source map file:
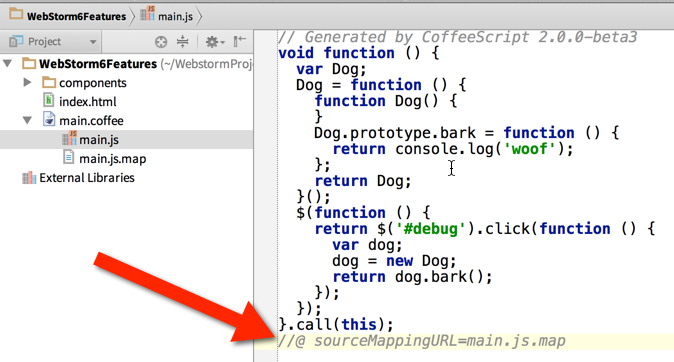
5. Add the “sourcemapping url” to your generated JS file (this process will improve as the CoffeeScript Redux project improves! We may add our own support, but for now it’s best to create a reusable live template snippet you can add quickly):
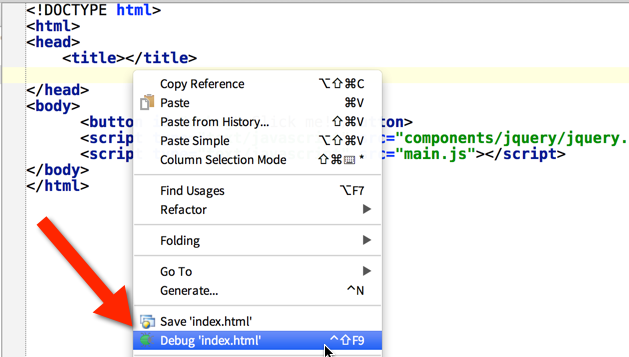
6. Start a debug session from your HTML file:
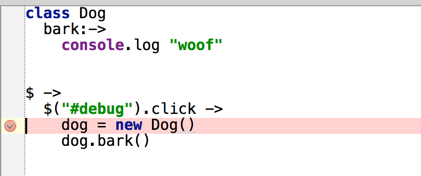
6. Add breakpoints to your CoffeeScript code:
Now you’ll be able to debug your CoffeeScript files as you would debug JavaScript!
Debugging other types of files that support sourcemaps (TypeScript, etc) is even easier: just set up the watcher, put breakpoints and start a debug session.
Please download the latest build, provide feedback for bugs and feature requests here, and leave questions in the comments below or in our forums!
Develop with pleasure!
-JetBrains WebStorm Team
Subscribe to WebStorm Blog updates


