dotMemory 4 Beta: Memory Profiling Better Than Ever Before

As you may have noticed, a totally renewed dotMemory 4 is on its way. Meanwhile, we are proud to introduce dotMemory 4 Beta!

dotMemory 4 offers a lot of new functionality that helps you optimize memory usage in your applications, find memory leaks, and address other types of memory issues like never before.
Let’s have a closer look on features you can already try on:
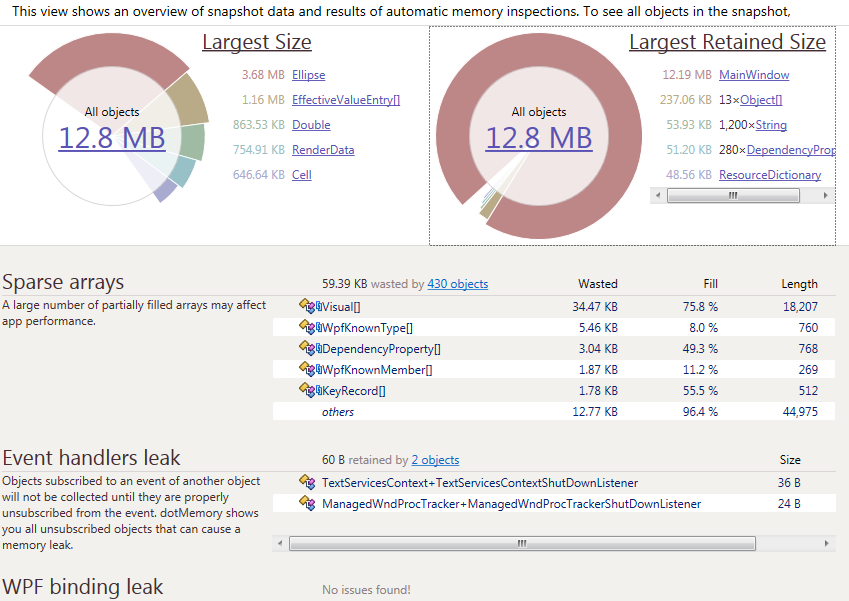
Powerful automatic inspections
To ease your task, dotMemory automatically scans your snapshot for most common types of memory issues. These inspections can be a great starting point in analyzing a snapshot if you’re not sure where to begin.
Easy and comprehensive UI
While memory profiling has the reputation of being for pros only, dotMemory’s unique user interface lowers that entry barrier dramatically. You can start memory issues investigating straightforward.
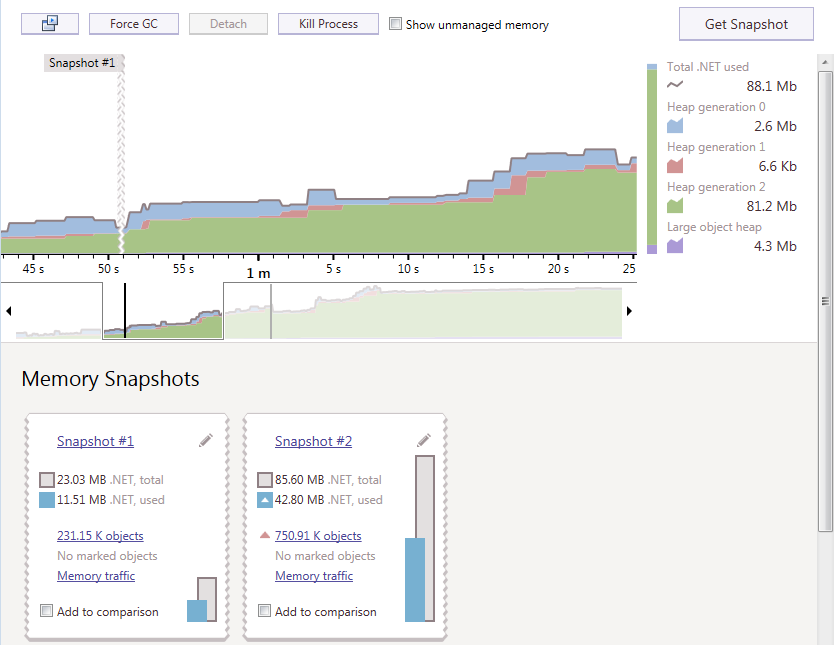
Timeline view with real-time data collection
In order to monitor memory consumed by your application, get snapshots and drop them to compare in one click.
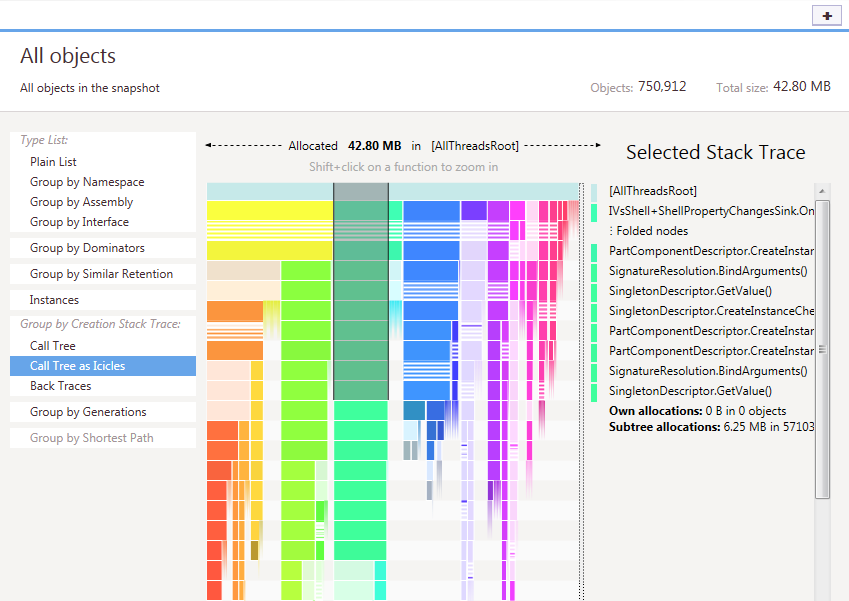
Multiple views on data
Examine objects in the heap from multiple views. Want to know how objects relate to each other? What objects do they reference and through what fields? Which calls created these objects? No problem! dotMemory has a view for everything.
Comparing memory snapshots
Comparing two snapshots is the main way to find objects that are causing a memory leak. Use the comparison view to find out how many objects were created between snapshots and how many objects were collected.
Analyzing memory traffic
Excessive allocations and garbage collections may imply significant memory management overhead. Use the traffic view to understand what objects are created/collected most intensively in your app and what functions are causing this memory traffic.
Remote profiling
Profile apps not only on your local computer but on any computer in your network or on the Internet. Remote profiling is especially helpful when you need to profile a web app on a production server.
Profiling API
Picking the right moment to get a snapshot is very important for memory analysis. Use the dotMemory API calls to take snapshots at exact places of your code.
Support for various .NET applications
Profile apps based on .NET Framework 2.0 to 4.5.1, Silverlight 4, Silverlight 5, Windows Store and IIS applications.
Visual Studio integration
dotMemory integrates with Visual Studio so you can start a memory profiling session right from the IDE, whenever you need.
For a more detailed overview of dotMemory 4 Beta functionality, please check the brand new dotMemory 4 website. That’s right, dotMemory now has a dedicated website, albeit still in Beta.
By the way, the resources available for you to know dotMemory 4 even better:
- Tutorials: Getting Started with dotMemory 4, How to find a memory leak with dotMemory 4, and How to optimize memory traffic with dotMemory 4;
- dotMemory online help and FAQ;
- “dotMemory 4: What’s inside” webinar recording.
Please download dotMemory 4 Beta and feel free to share you feedback with us via comments here! You can also contact our technical support if you have any questions and report issues to dotMemory bug tracker if you experience any. We’ll be happy to help. Thank you for choosing dotMemory.
Give it a try and enjoy!
Stay tuned for further announcements,
JetBrains dotMemory Team
Subscribe to a monthly digest curated from the .NET Tools blog:


