Working with dotTrace Home

When we announced the dotTrace 6, we’ve already had a quick look at the new starting point in our performance profiler: the dotTrace Home. We can use it to start a new local or remote profiling session for known .NET application types, attach to a running process, configure our profiling session and more. Let’s have a closer look!
Starting a Local Profiling Session
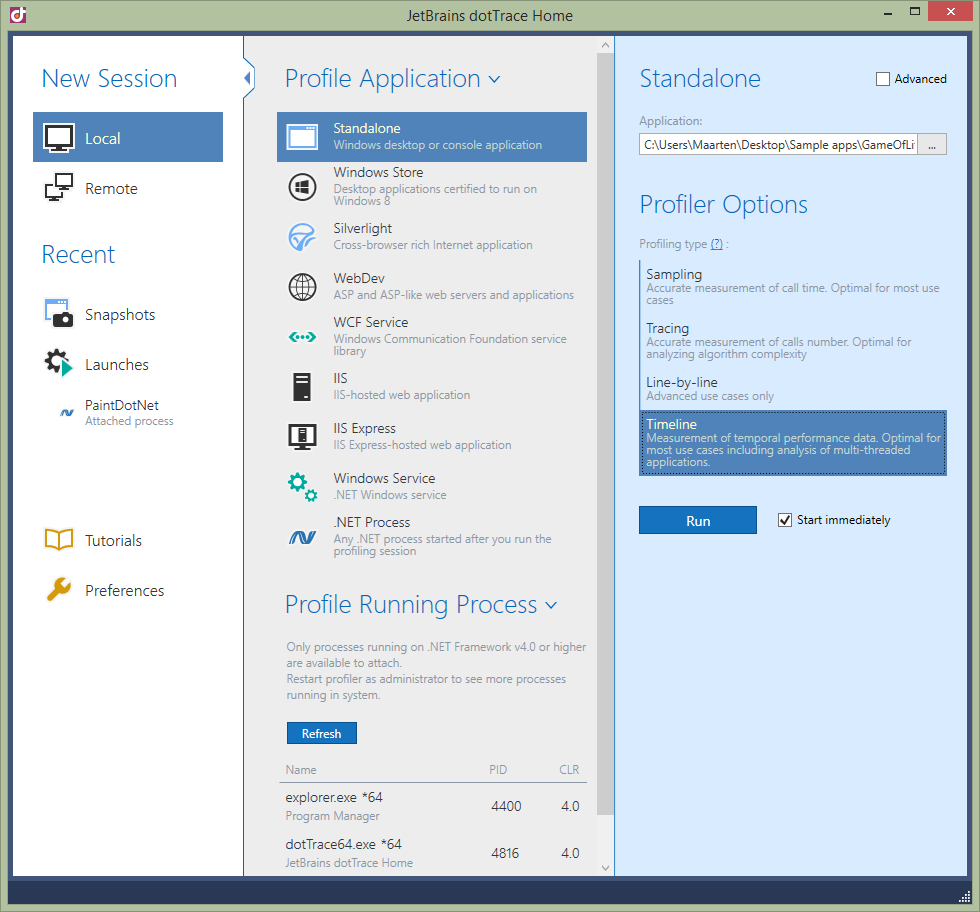
Left-to-right, dotTrace Home shows us three panes. The leftmost pane lets us pick the action we want to perform, such as starting a profiling session. Next, we can select the application type or process we want to profile from the middle pane. On the right, we can specify additional options for the profiler, such as the profiling type or application startup arguments.
Let’s start a new local session. We can profile an application that we want to be launched by dotTrace, or attach the profiler to an already running process. dotTrace 6 lets us profile a variety of application types:
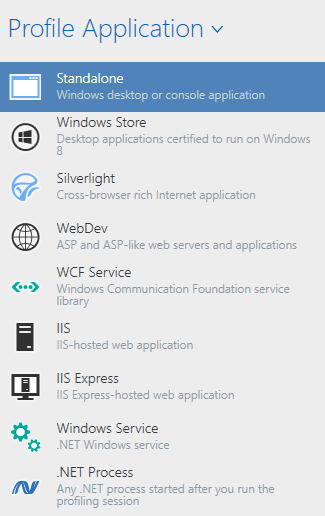
- Standalone application, such as a Windows desktop or console application;
- Windows Store applications;
- Silverlight applications;
- ASP.NET and ASP.NET-like webservers, for example with OWIN based webservers such as Kestrel, self-hosted Web API’s, Nancy and so forth;
- WCF Services;
- IIS or IIS Express-hosted web applications;
- Windows Services;
- Any other .NET process.
Under the Profile Running Process section, we can choose to attach to an already running process. All processes that are running under .NET 4 or higher that are visible to the current user will be shown and can be attached to. Running dotTrace 6 with administrator privileges will show additional processes that are available to administrators only.
Starting a Remote Profiling Session
For those performance problems that only happen in staging and production which somehow can never be reproduced on our local machine, dotTrace 6 lets us profile remote applications, too. All we have to do is make sure that the dotTrace Remote Agent is copied onto the remote server and then connect to it from dotTrace.
Next, we can enter the URL to our remote agent, typically something similar to http://hostname:9000/RemoteAgent/AgentService.asmx. dotTrace will then show us a list of running processes on the remote server which we can connect the profiler to.
Profiler Options and Profiling Types
Once we select an application type or a running local or remote process, we can tell dotTrace our profiling preferences. These will differ based on the application type we want to profile, but in general we can specify some specific details for launching or connecting to the application and pick the profiling type.
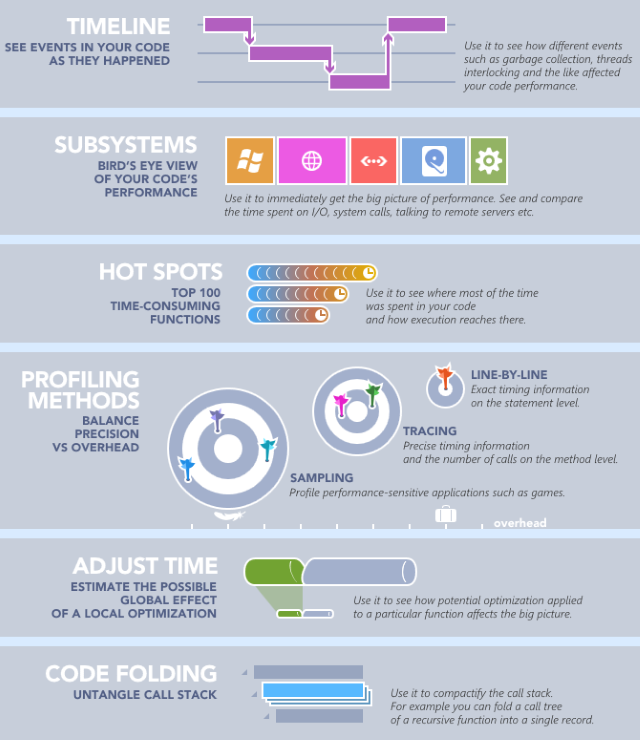
dotTrace 6 provides us with four profiling types that collect performance data in different ways:
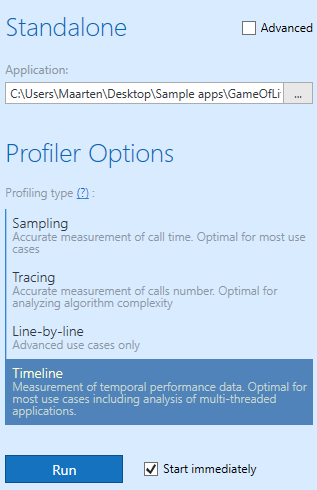
- Sampling provides accurate time measurement of calls, but can not reliably measure the number of calls. Sampling is recommended for most cases and is ideal when looking for performance issues in our app for the first time.
- Tracing provides accurate calls number measurement, but time measurement may be inaccurate due to profiler overhead. It’s an ideal way of profiling and analyzing algorithm complexity, when info about the exact number of calls is more valuable than exact call time values.
- Line-by-line measures call numbers of every statement in our code and lets us see how many times a line of code was executed. Call time values are inaccurate due to huge profiler overhead.
- dotTrace 6 introduces a new Timeline profiling type, which collects temporal data about thread states, application events and other multi-threading data using Event Tracing for Windows (ETW). It’s less suitable for measuring exact call numbers of every statement, but it comes in very handy when analyzing multithreaded applications. It not only allows us to see which calls were made by our application, but also how these calls were distributed over time.
Ticking the Advanced checkbox reveals some additional options, for example letting us use the profiler API from our code.
Recent
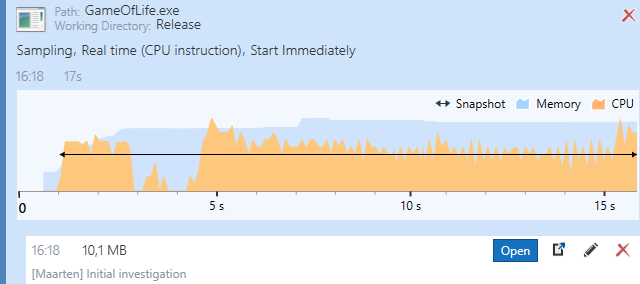
In the left pane of dotTrace Home, recent profiling sessions and snapshots will be shown. After selecting a previous session, we can run a new session with the same settings. Ticking Show details expands any previous snapshot that was captured and shows memory and CPU usage over time. We can then re-open these snapshots and continue analysis of our application.
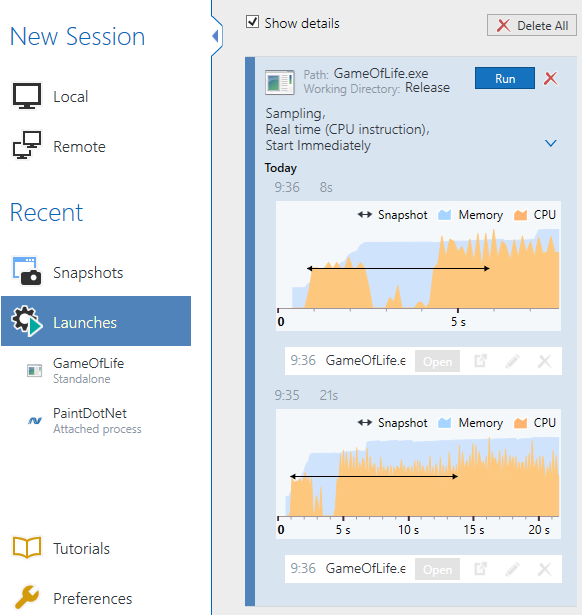
Recent snapshots and launches can be annotated with comments or a description of what we were investigating. dotTrace also lets us export snapshots to a file so we can distribute them amongst team members. Or have a client capture a snapshot and send it to us for further analysis.
Tutorials
Performance profiling is a complex topic. Applications typically execute a lot of statements, may start multiple threads, generating a lot of data. From dotTrace Home, we can call up a series of tutorials that explain how the different aspects of .NET performance profiling work and how we can use dotTrace to analyze our application’s behaviour.
Give dotTrace 6 a try! All feedback, comments, issues and suggestions are welcome in our issue tracker or through the comments below.
Subscribe to a monthly digest curated from the .NET Tools blog:


