Profiling Mono and Mono Unity Apps on Windows, macOS, and Linux

Back in Rider 2018.3, we added a performance profiler to Rider. As we try to deliver new features as quickly as possible, the integrated profiler had some limitations: it only supported the profiling of .NET Framework and .NET Core applications on Windows. Now, it’s time to fill the gap. In Rider 2019.1, the profiler gets support for Mono and Mono Unity – and not just on Windows but on macOS and Linux as well.
Let’s look at what it can do for you.
What is currently supported?
| Windows | macOS | Linux | |
| .NET Framework | + | n/a | n/a |
| .NET Core 1.0+ | + | – | – |
| Mono 5.10+ | + | + | + |
| Mono Unity 2018.3+ | + | + | + |
As you can see, the profiler still lacks support for .NET Core on macOS and Linux. Unfortunately, we can’t do everything at once, so this will happen in a future release. Also, as of EAP3, there are no console profiling tools for macOS and Linux. But, unlike the support for .NET Core, the tools will be added in one of the upcoming 2019.1 EAP releases.
How to profile Mono apps?
Absolutely no changes here. The workflow is the same as with regular .NET Framework apps (more details in this post):
- Choose a run configuration (what you’re going to profile).
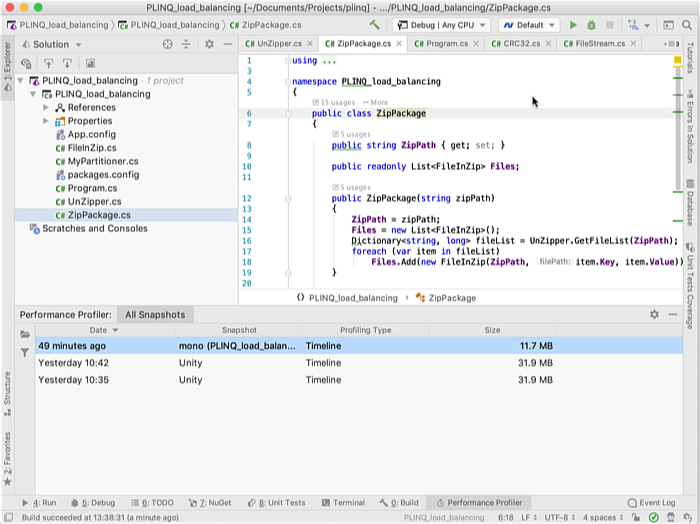
- Choose a profiling configuration (how you’re going to profile). Note that there’s a special profiling configuration for Mono apps: Timeline (Mono). Because of limitations in Mono, other profiling modes are not available.
- Run profiling and take snapshots.
How to profile unit tests?
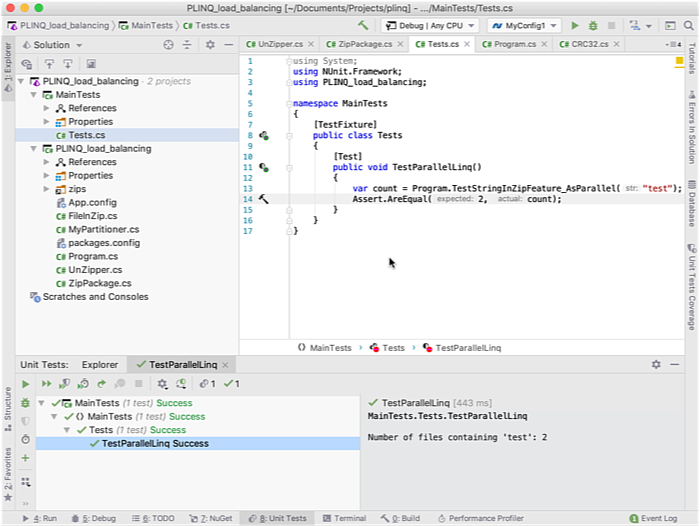
Profiling of Mono unit tests is also supported. Simply select a unit test and then run Profile from the context menu.
How to profile Mono Unity apps?
This one is a little bit more complicated. The workflow is almost the same, but there’s a difference when it comes to running a profiling session:
- Choose a run configuration: For a Unity app, it’s always either Attach to Unity Editor or Attach to Unity Editor and Play configs.
- Choose a profiling configuration. As well as with Mono apps, there’s a separate profiling configuration: Timeline (Unity).
- Run profiling and get snapshots.
When profiling a Unity application, the profiling target is always the Unity Editor. The problem is that the Editor is probably running simultaneously with Rider, so you cannot start profiling it. Therefore, when trying to run Timeline (Unity), Riders asks you to:- Close the Unity Editor first.
- Run the Timeline (Unity) profiling one more time. Rider will take care of the rest: it will run the Unity Editor and start the profiling session.
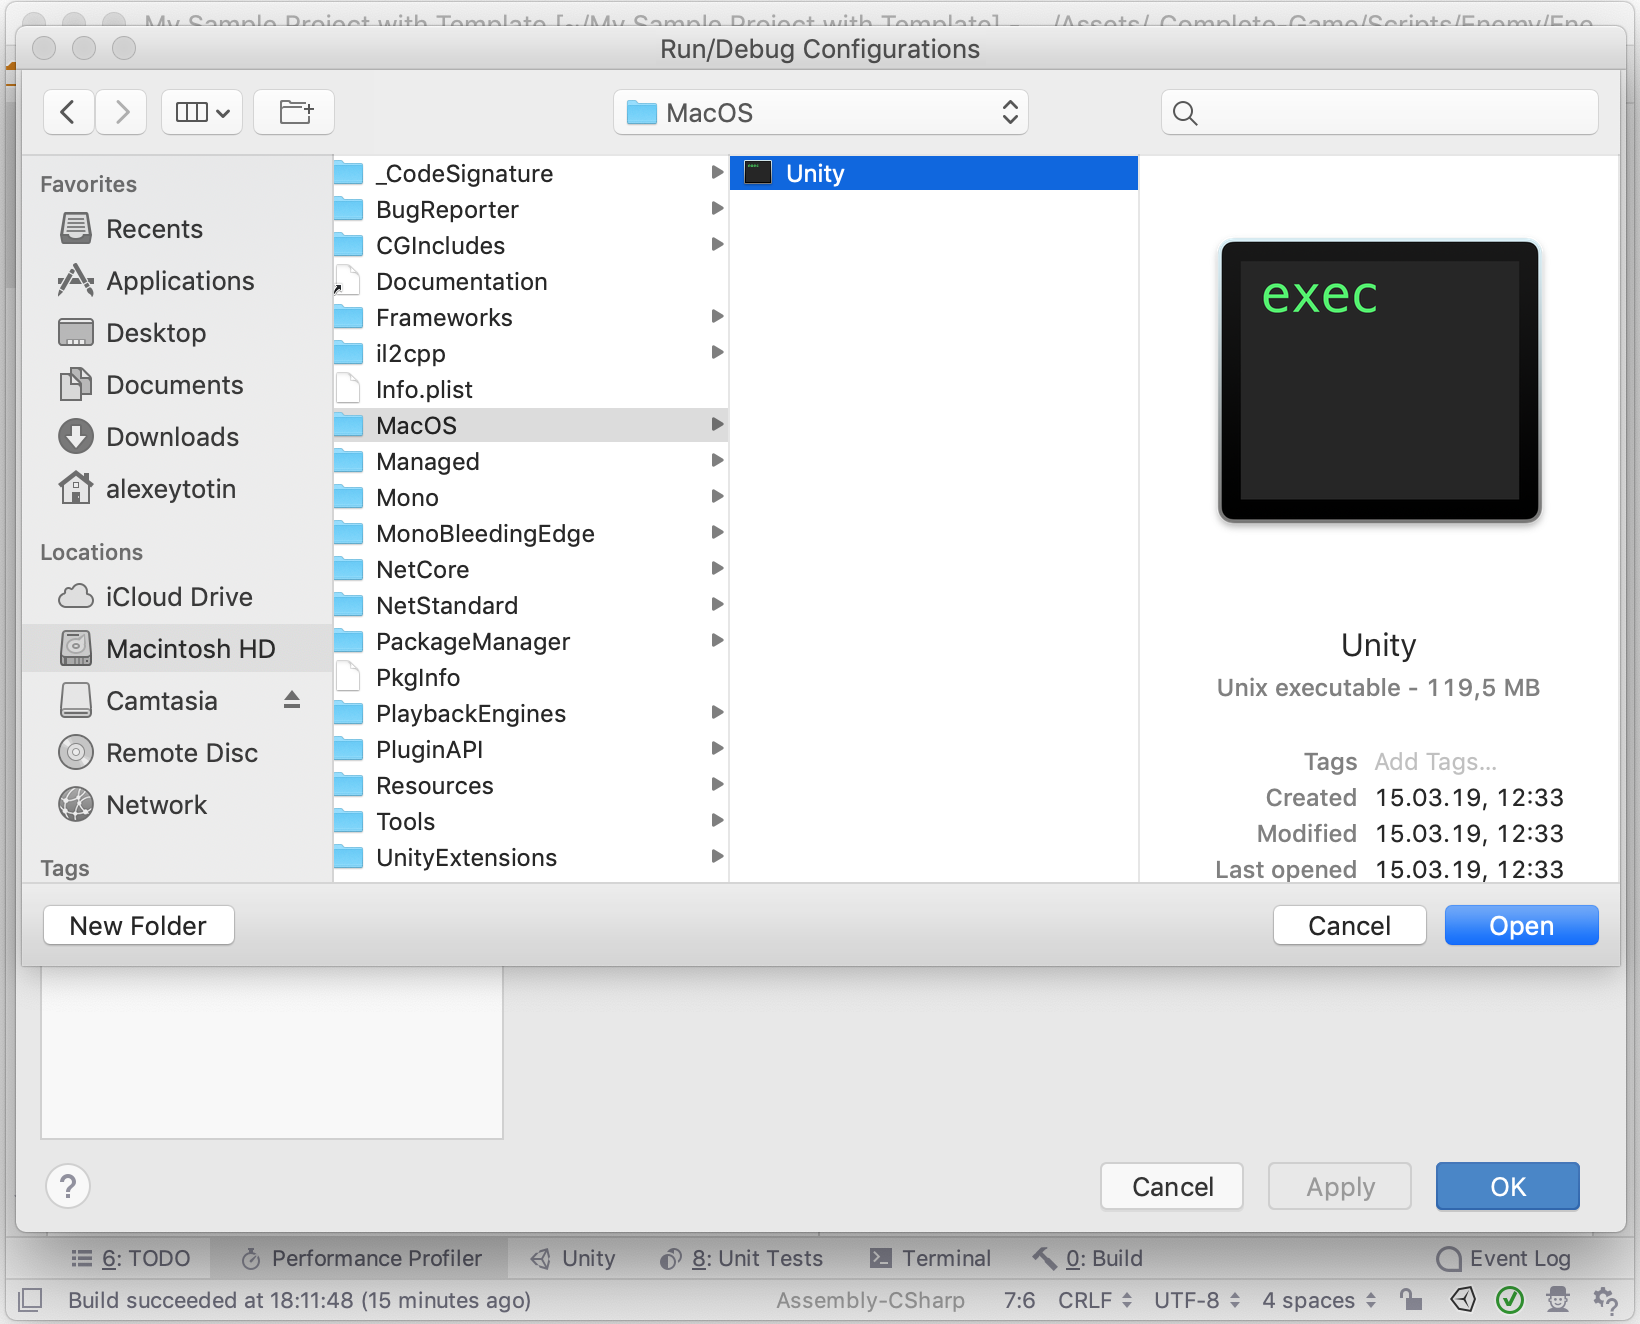
Note that instead of restarting Unity Editor, you have an alternative to simply run the compiled game under profiling. In this case, in step 1 you should select the Unity Executable run configuration and specify the path to the game executable.
Another usage of the Unity Executable configuration is to run one more Unity Editor instance with profiling enabled. All you need is to specify the path to the Unity Editor executable instead of the game.
That’s all for now! To try new Rider profiling capabilities, download the latest Rider 2019.1 EAP. Stay tuned!
Subscribe to a monthly digest curated from the .NET Tools blog:


