Cross-Platform dotCover Console Runner and more – What’s New in dotCover 2019.2

In the 2019.2 release, the dotCover team was mainly focused on the console runner tool. The result is some good news about the tool, including one important fix specially for .NET Core users:
- The dotCover console runner is available not only on Windows, but on macOS and Linux as well.
- The console runner can perform coverage analysis in Mono projects and gets a new command for analyzing .NET Core projects.
- The issue with 0% coverage and .NET Core unit tests was fixed. The dotnet dotCover test workaround is no longer needed, but you can still use it if you find this way of running coverage analysis more convenient.
Let’s try these brand-new features in action: we’ll profile some unit tests targeting .NET Core and Mono and we’ll do this on Mac. In addition, we’ll recall how you can use dotnet dotcover test.
Getting the console runner
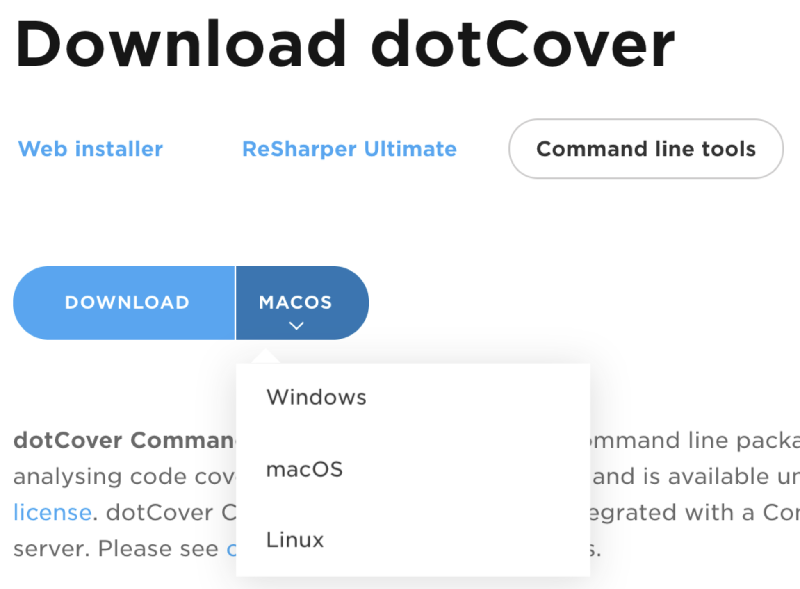
The console runner is distributed as a .zip archive. When downloading the tool, make sure to select the target operating system:
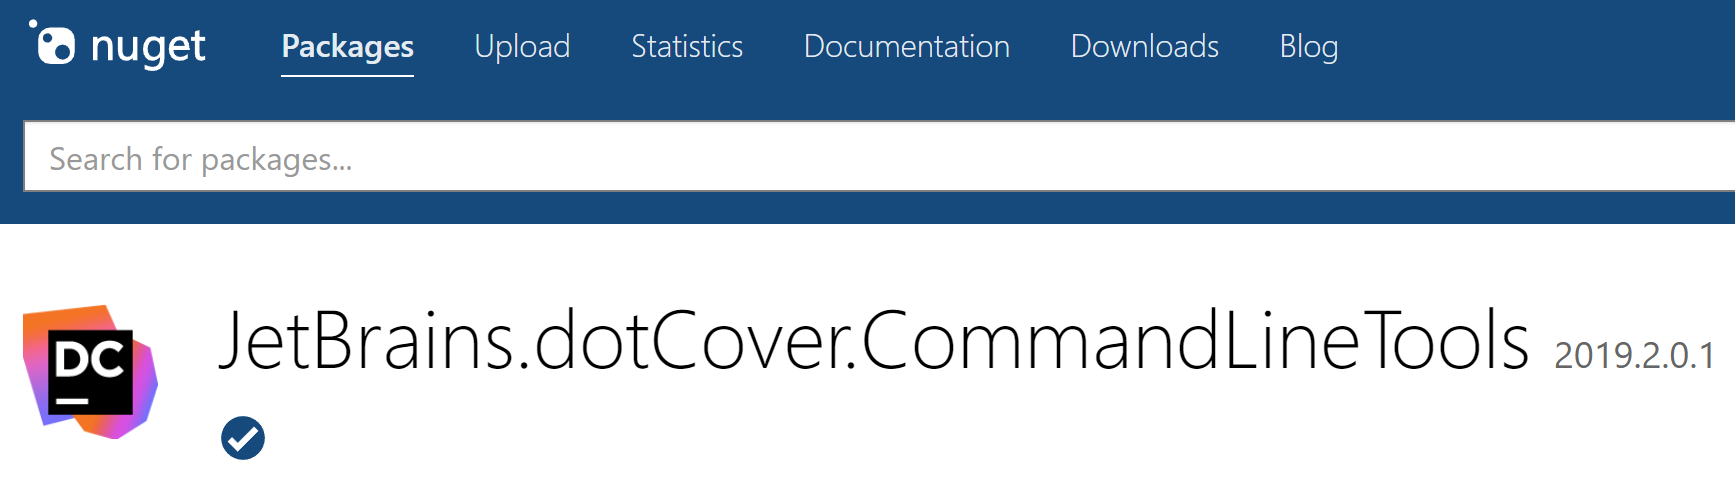
Another option is to get the console runner as a NuGet package:
After you download and unpack the console runner, it makes sense to add the tool’s location to system PATH (so that you can run it from everywhere). Note that the tool on Windows is dotCover.exe, while on Unix systems, it is dotCover.sh.
We’re ready to start coverage analysis!
Getting .NET Core unit tests coverage
For sure, the most demanded feature for the console tool was .NET Core support. We added a new command that runs the dotnet driver: cover-dotnet or a shorter version – dotnet. It runs dotnet under coverage analysis (as if you specified the path to dotnet in --TargetExecutable).
When we want to get coverage of tests in some project, all we need to do is open the solution folder and run:
dotCover.sh dotnet --output=myRep.html --reportType=HTML -- test
Here’s what will happen:
- In this example, we run the command from the project folder. Alternatively, you can specify the full path to the project after test.
--output=myRep.html --reportType=HTMLtells dotCover to generate a coverage report in the HTML format.-- testat the end is an argument passed todotnet. Actually, you can replace it with--TargetArguments="test"but that is much longer.- You’ve probably noticed that we’re using Unix-style syntax for command-line arguments. You can use this syntax on Windows as well. For example, the following is interchangeable on Windows (but not on macOS and Linux):
/TempDir:"../myDir" and --tempDir="../myDir" - In this example, we’re getting coverage of unit tests, but you can also use
dotCover.shfor covering applications.
Getting .NET Core unit tests coverage with dotnet dotCover test
Some time ago, dotCover added the ability to run coverage analysis directly via the dotnet driver:
dotnet dotCover test
Initially, the feature was added as a workaround for this issue. The issue is fixed in 2019.2, so, technically, the workaround is no longer needed. Nevertheless, many dotCover users find this ability useful in different cases. The main advantage here is that you don’t need to download the dotCover console runner (a plus in, say, docker containers). So, we will keep supporting this feature.
We did make some changes in 2019.2. The main change is the name of the package you must specify in .csproj.
Here are the steps to make dotnet dotcover test work (steps 1-4 are made only once per project):
- Go to nuget.org and find the JetBrains.dotCover.DotNetCliTool package.
- Do NOT reference this package in your unit tests project. Instead, open its
.csprojfile and add a line that contains the package name and current version into an<ItemGroup>element:
<DotNetCliToolReference Include="JetBrains.dotCover.DotNetCliTool" Version="2019.2.0.1" /> - In the command line, go to the directory containing your unit tests project.
- Run
dotnet restore - Run tests with coverage analysis:
dotnet dotсover test
Getting Mono unit tests coverage
There’s also a new command for Mono projects: cover-mono or just mono. The workflow here is somewhat different compared to dotnet: to run tests, you must explicitly specify unit test runner executable. For example, with xUnit, it may look as follows:
dotCover.sh mono --output=myRep.html --reportType=HTML -- ../../../packages/xunit.runner.console.2.4.1/tools/net472/xunit.console.exe xUnitTests.dll -noappdomain
Some notes:
- –
-output=myRep.html --reportType=HTMLtells dotCover to generate a coverage report in the HTML format. - At the end, after the double dash
--, we specify a path to xUnit console runner (in our example, it is referenced by the project) and a path to a .dll with tests. -noappdomaintells the xUnit runner to not use app domains when running test code. For details, see the list of known issues below in this post.
Unfortunately, there are a number of known issues with Mono projects for now:
- It is not possible to profile child processes. As a result, it is not possible to get coverage of NUnit tests (NUnit runs tests in its child processes).
- If code runs in a child domain, you’ll get zero coverage. That’s why it’s important to specify the
-noappdomainargument when getting coverage of Mono tests. - Default coverage filters for filtering out system and unit testing framework assemblies do not work. You will see these assemblies in coverage results.
- It’s not possible to merge snapshots.
We look forward to your questions and remarks – feel free to ask in the comments below! It’s also worth mentioning that dotCover is a part of ReSharper Ultimate which is available for download here.
Subscribe to a monthly digest curated from the .NET Tools blog:


