Docker Compose, edit & continue for C# 8 and more debugger updates in Rider 2019.3

Great news! If you are using our latest Rider 2019.3 release, you get to enjoy various debugger updates! .NET apps running with Docker Compose can be debugged with Rider, an update to edit & continue adds C# 8 support, and we’ve improved the user experience for exception settings.
The debugger tool window received some updates as well, with recursive Pin to Top evaluation and the Jump to Type Source action. And we’ve made some enhancements to remote debugging as well.
In other words: a great excuse for a blog post with more details! Let’s have a look.
Debugging .NET apps with Docker Compose
In Rider 2018.2, we introduced support for debugging ASP.NET Core apps in a local (Linux) Docker container. Over the past couple of releases we have improved that experience, and are now adding initial support for debugging .NET applications with Docker Compose in Rider!
Before we look at that, here’s a very quick introduction to Docker Compose.
Docker Compose introduction
Docker Compose lets us build applications that are composed of multiple containers. For example, we could create a web application that runs in one container, and communicate with an HTTP API running in another container. Docker Compose makes sure both are deployed at the same time, and creates a virtual network between those containers so they can easily communicate with each other.
We can create a docker-compose.yml file that “composes” two services. It will point to their own Dockerfile, and adds names for each container/service, acmecorp.web and acmecorp.web.api.
version: '3.4'

services:
  acmecorp.web:
    image: ${DOCKER_REGISTRY-}acmecorpweb
    build:
      context: .
      dockerfile: AcmeCorp.Web/Dockerfile
    ports:
      - "53961:80"
  acmecorp.web.api:
    image: ${DOCKER_REGISTRY-}acmecorpwebapi
    build:
      context: .
      dockerfile: AcmeCorp.Web.Api/Dockerfile
    ports:
      - "54011:80"
Docker Compose will deploy and launch both of these when we run docker-compose up, and allows the containers to communicate based on their names. For example, the web application could request data from the HTTP API using acmecorp.web.api as the host name:
public async Task<IActionResult> Index()
{
    var forecastsJson = await _httpClient.GetStringAsync(
        "http://acmecorp.web.api/weatherforecast");

    // ...

    return View(forecastsModel);
}
Very convenient! But how can we debug these…
Debugging with Rider and Docker Compose
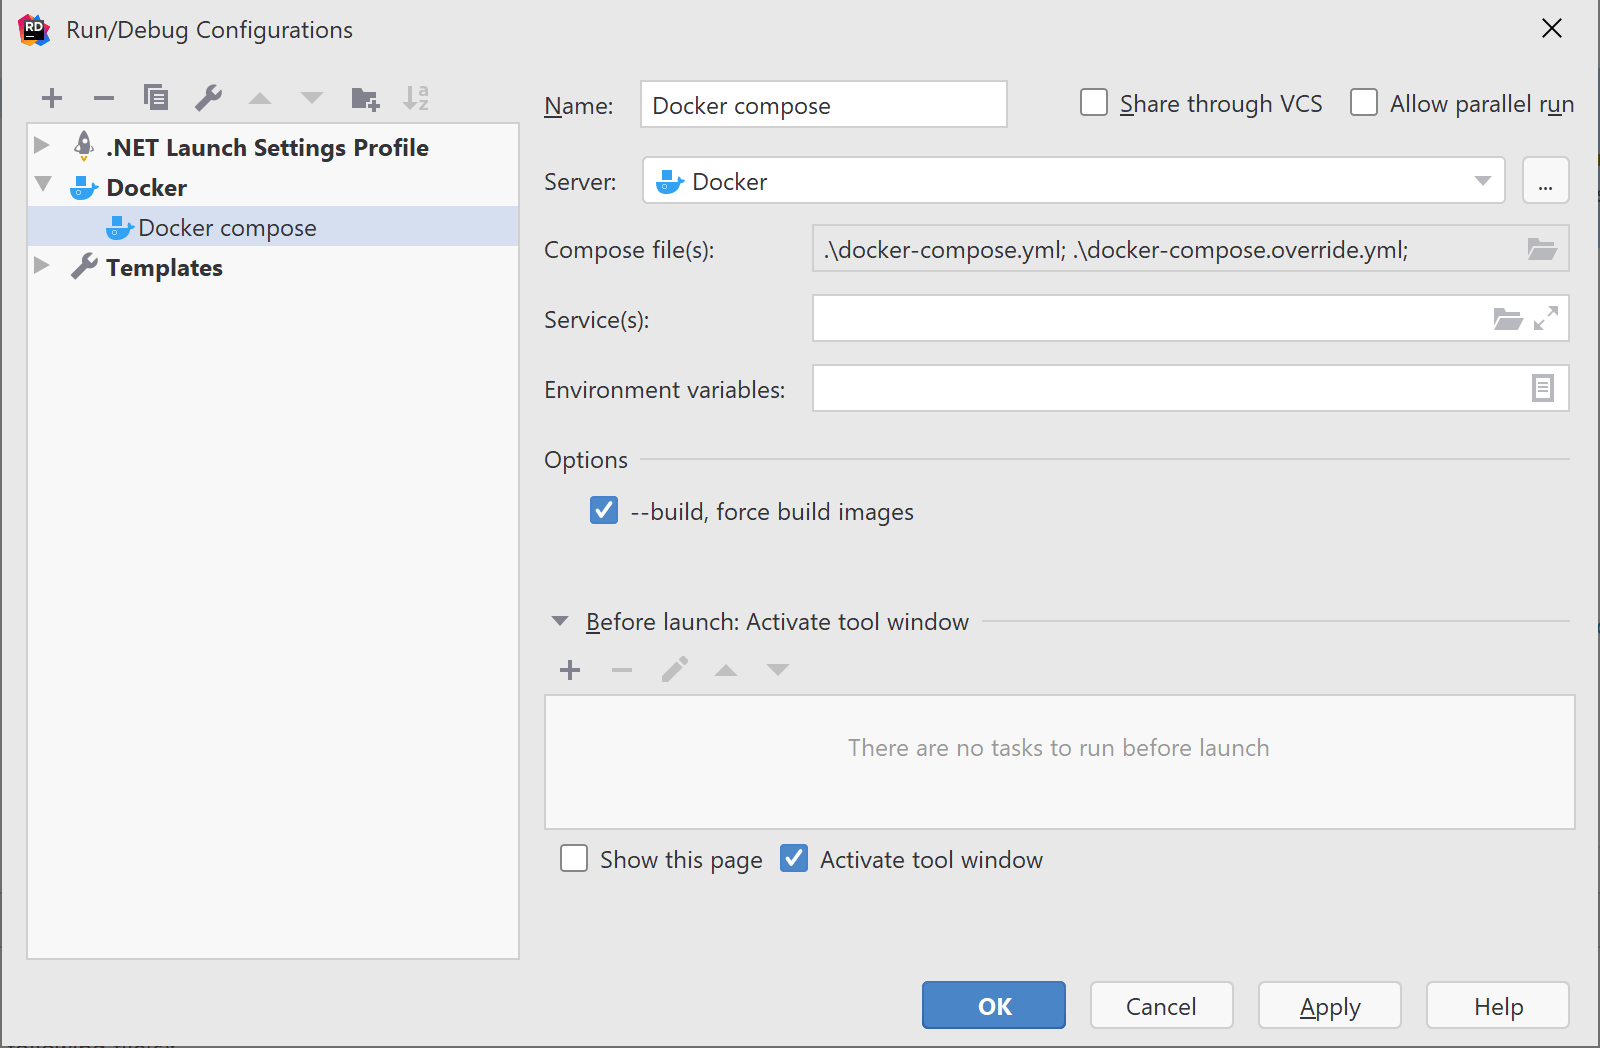
To be able to run and debug docker-compose.yml files, we will have to create a new Run/Debug configuration. From the Run | Edit Configurations… menu, we can add a new configuration of type Docker | Docker compose.
We’ll have to select our Docker server, as well as the path to the docker-compose.yml files we want to launch. Optionally, we can specify the services to run, which could be useful if you’re only working on a subset of the services in your project.
Note: learn more about Run/Debug Configurations in Rider in part 2 of our debugger series.
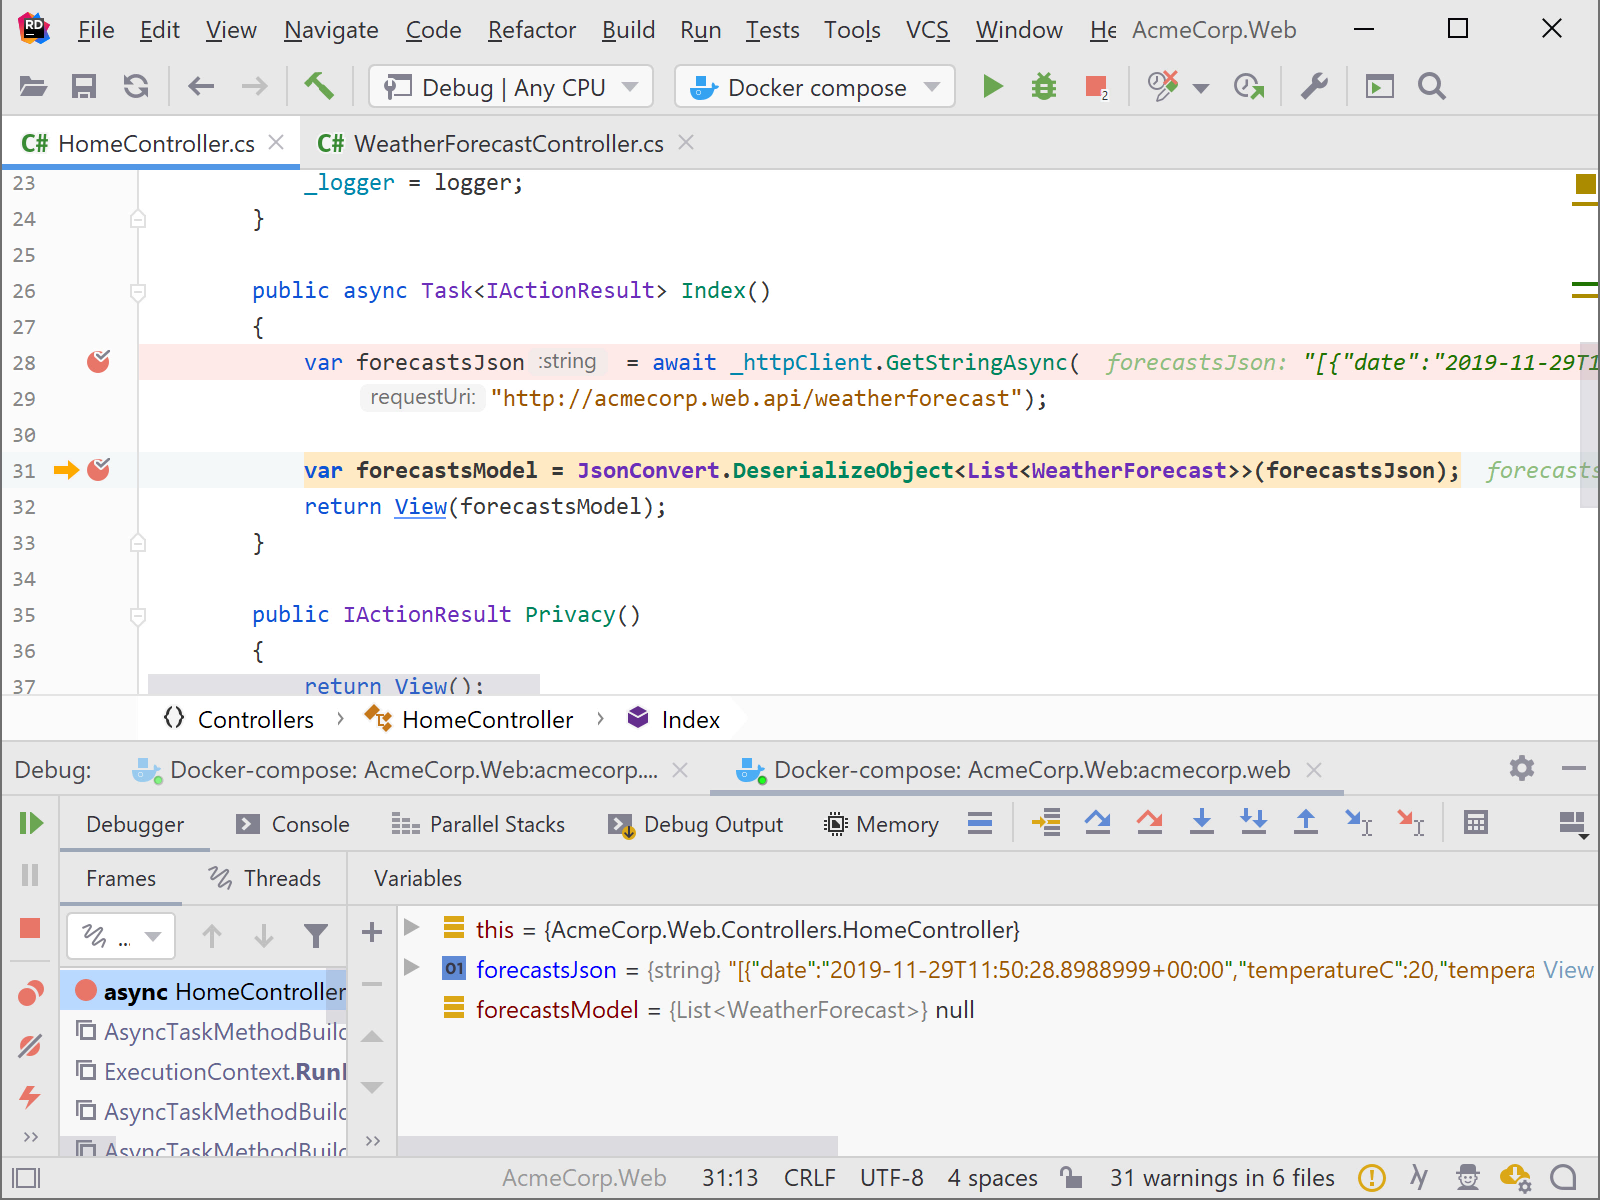
Once this configuration is in place, we can Run or Debug it. Since we’re talking about debugging here, let’s go with that. Rider will build our projects and their containers and then will deploy them on our Docker host.
When all services are up and running, we’ll see multiple debugger tabs open, one for each application. We can debug our web application and the HTTP API at the same time, and step between both.
Do keep in mind this is an initial version of Docker Compose debugging in Rider and some limitations still exist. For example, stepping through code may be slow with some configurations. Give it a try and let us know what you think!
Edit & Continue – C# 8 Support
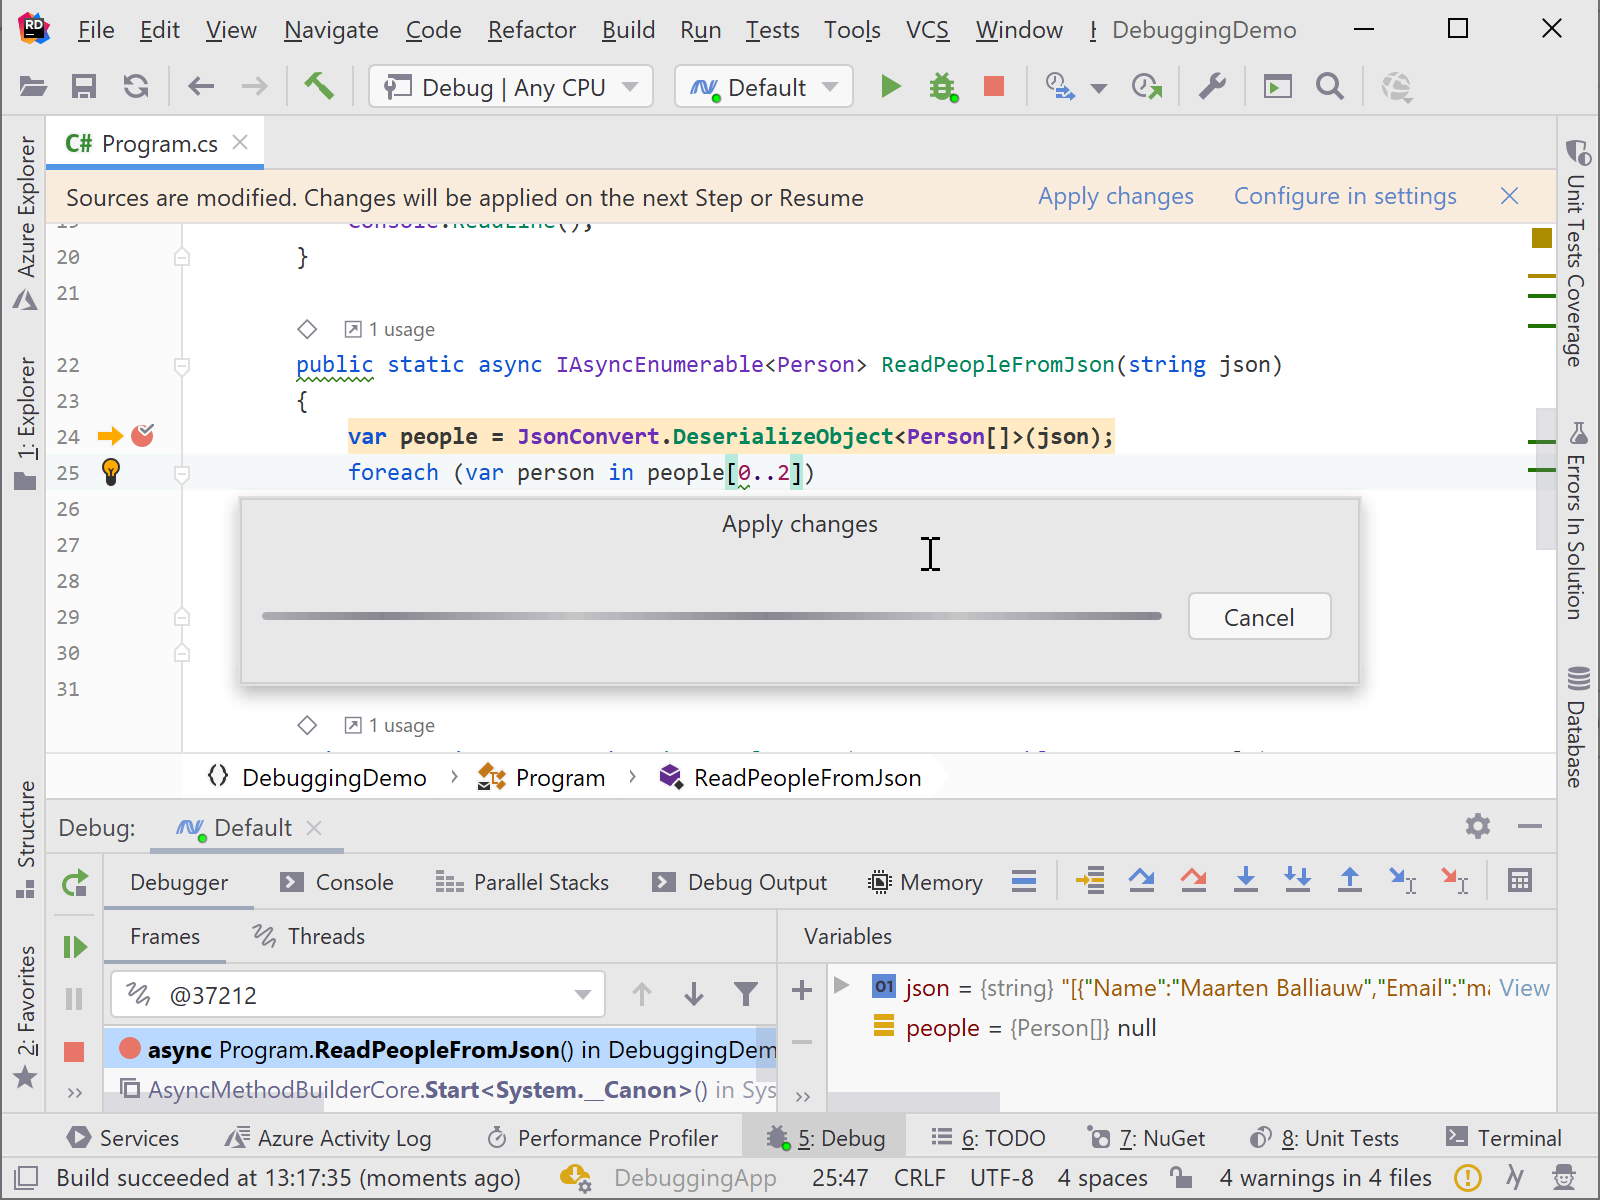
Earlier this year we introduced Edit & Continue, a debugger feature that lets us change our code while the application is running, without having to restart.
Rider 2019.3 adds support for C# 8, so we can edit our code while it is running – even if it uses indices and ranges, null-coalescing assignments, switch expressions and other C# 8 language features (read more…).
Keep in mind there are cases when modifying the code is not possible and a restart is required.
Better user experience for exception settings
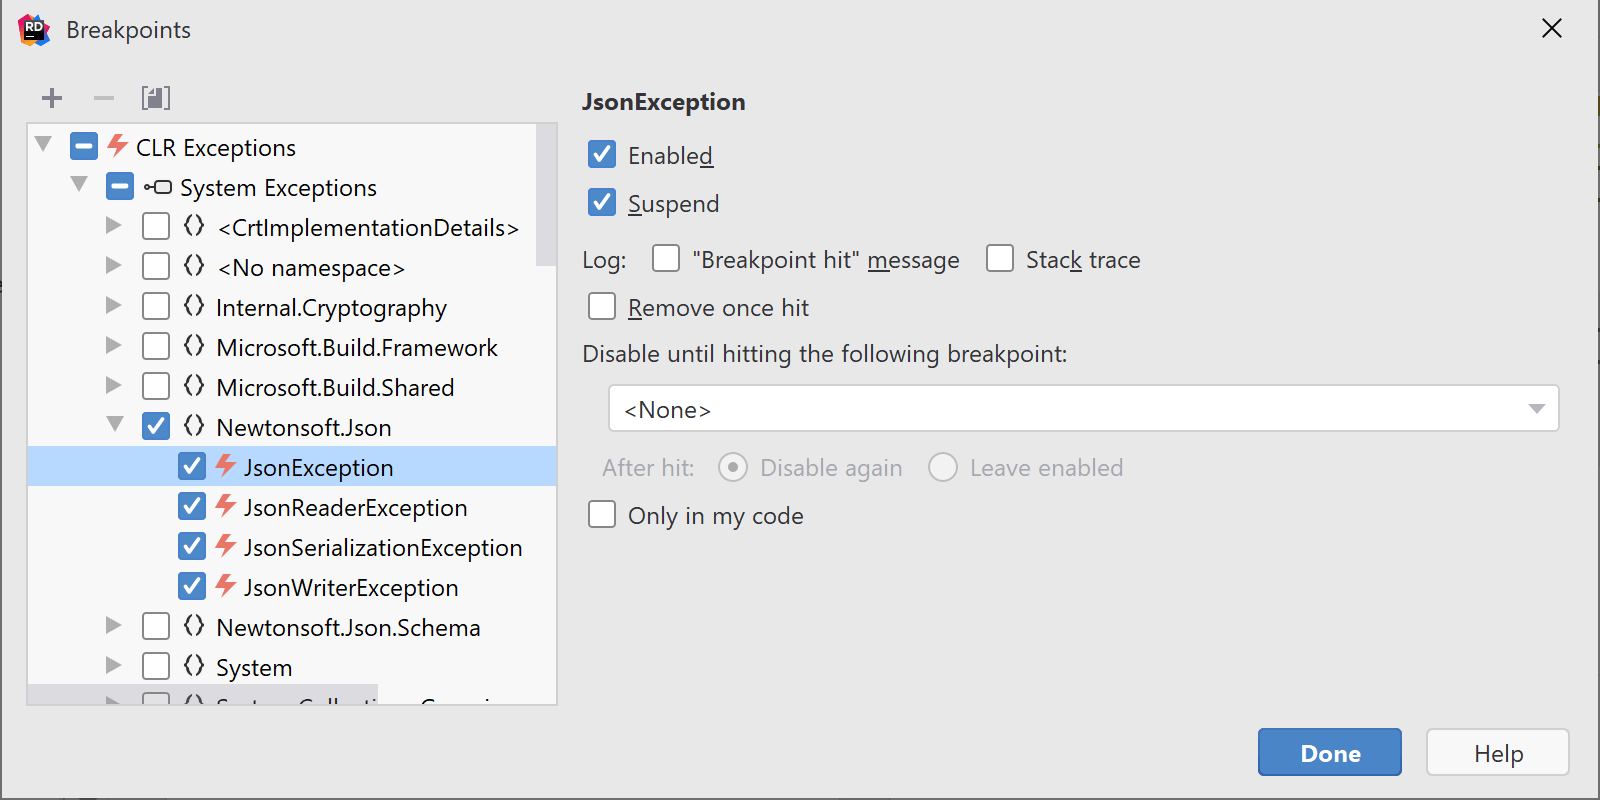
Exceptions are never fun to deal with. We can enable exception breakpoints in Rider so our IDE will suspend execution when exceptions happen, so we can figure out why they happen.
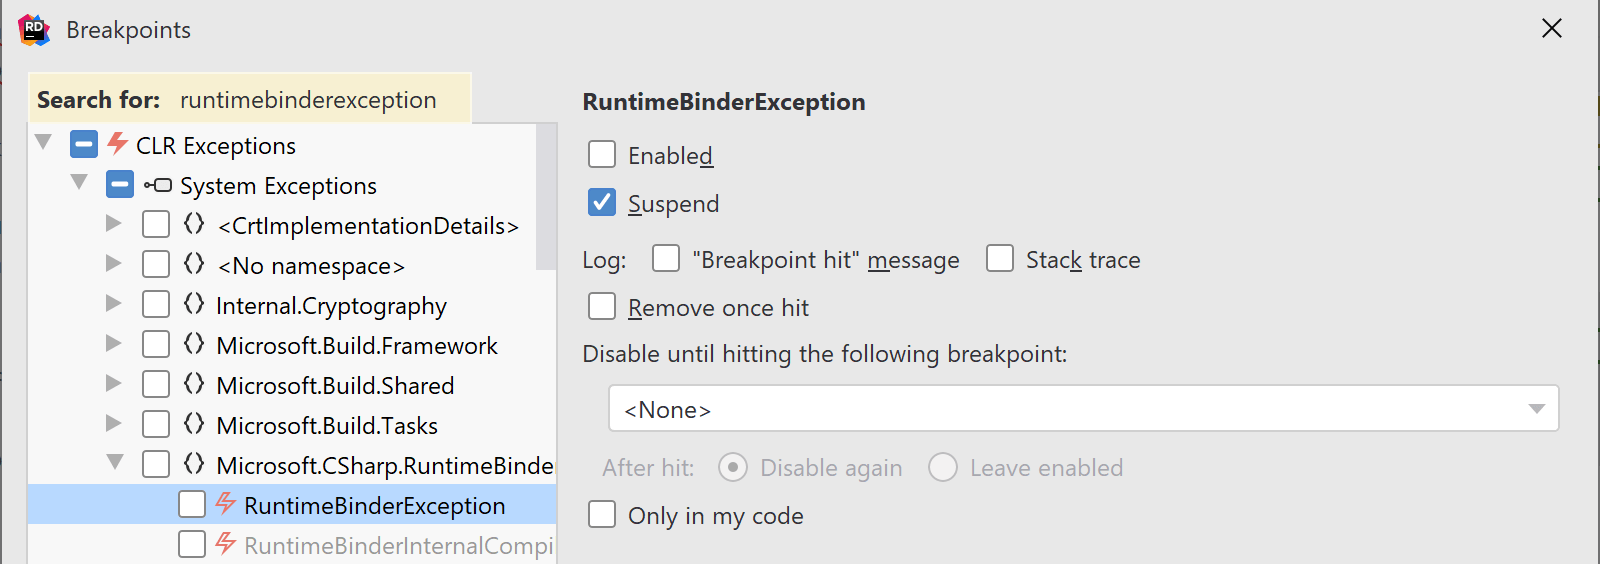
In Rider 2019.3, we have reworked the exception settings user experience. In the Breakpoints dialog (Ctrl+Alt+B in the Visual Studio keymap, or Run | View Breakpoints…), all exception types found in referenced assemblies and packages will be displayed, grouped by namespace. This makes it easier to discover potential exception types, and to enable breakpoints for exceptions from a specific namespace.
Speed search works here as well: start typing in the list to find a certain exception type.
Recursive Pin to Top evaluation
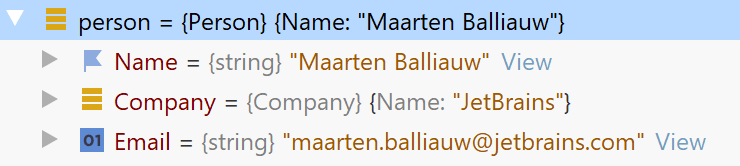
In the variables view, we can use Pin to Top to show info we’re interested in first. By pinning type properties, Rider’s debugger displays the data from those properties immediately, without having to add a DebuggerDisplayAttribute to our code.
Here’s an example where we pinned the Name property, which is now displayed at the top and in the description of person:
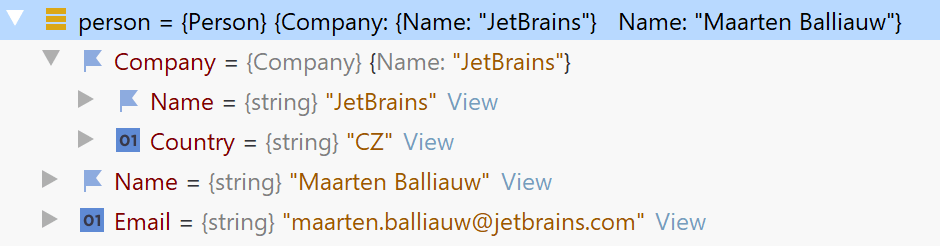
Rider 2019.3 now evaluates pinned properties recursively. In other words, if we pin Name, Company and Company.Name, we will see those on our person:
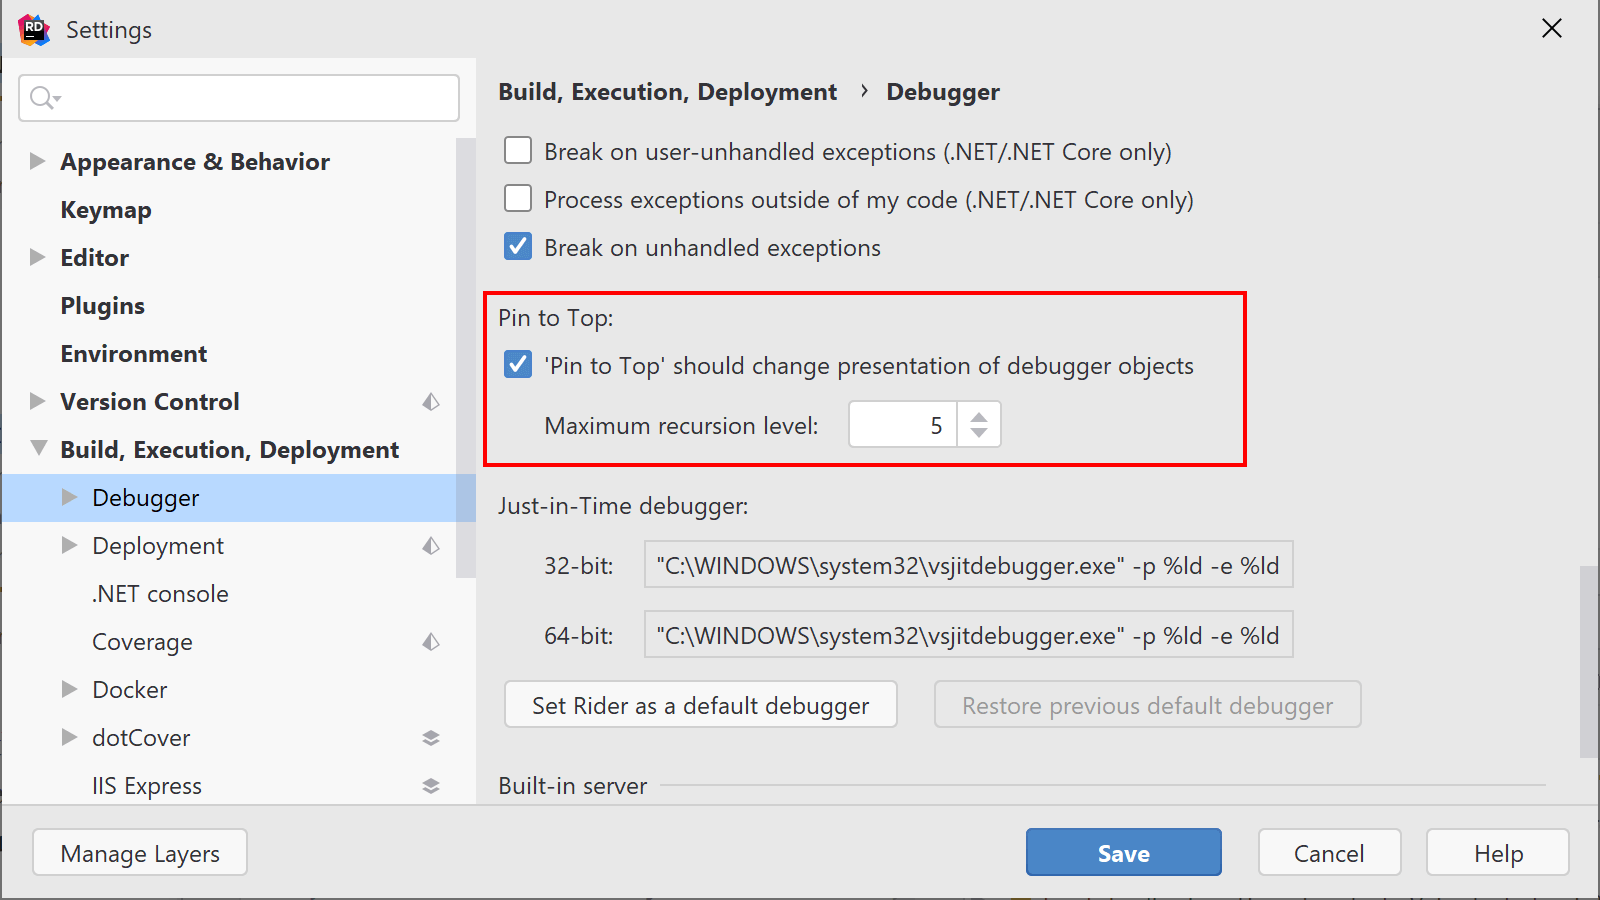
Pin to Top comes with cyclic dependency protection to avoid infinite loops while evaluating them. There’s also a recursion limit which can be configured in the settings, under Build, Execution, Deployment | Debugger:
What else is new?
So far, we have looked at the highlights, but there are more updates to Rider’s debugger! As with every release, we’ve fixed several bugs and made a number of smaller improvements to existing functionality.
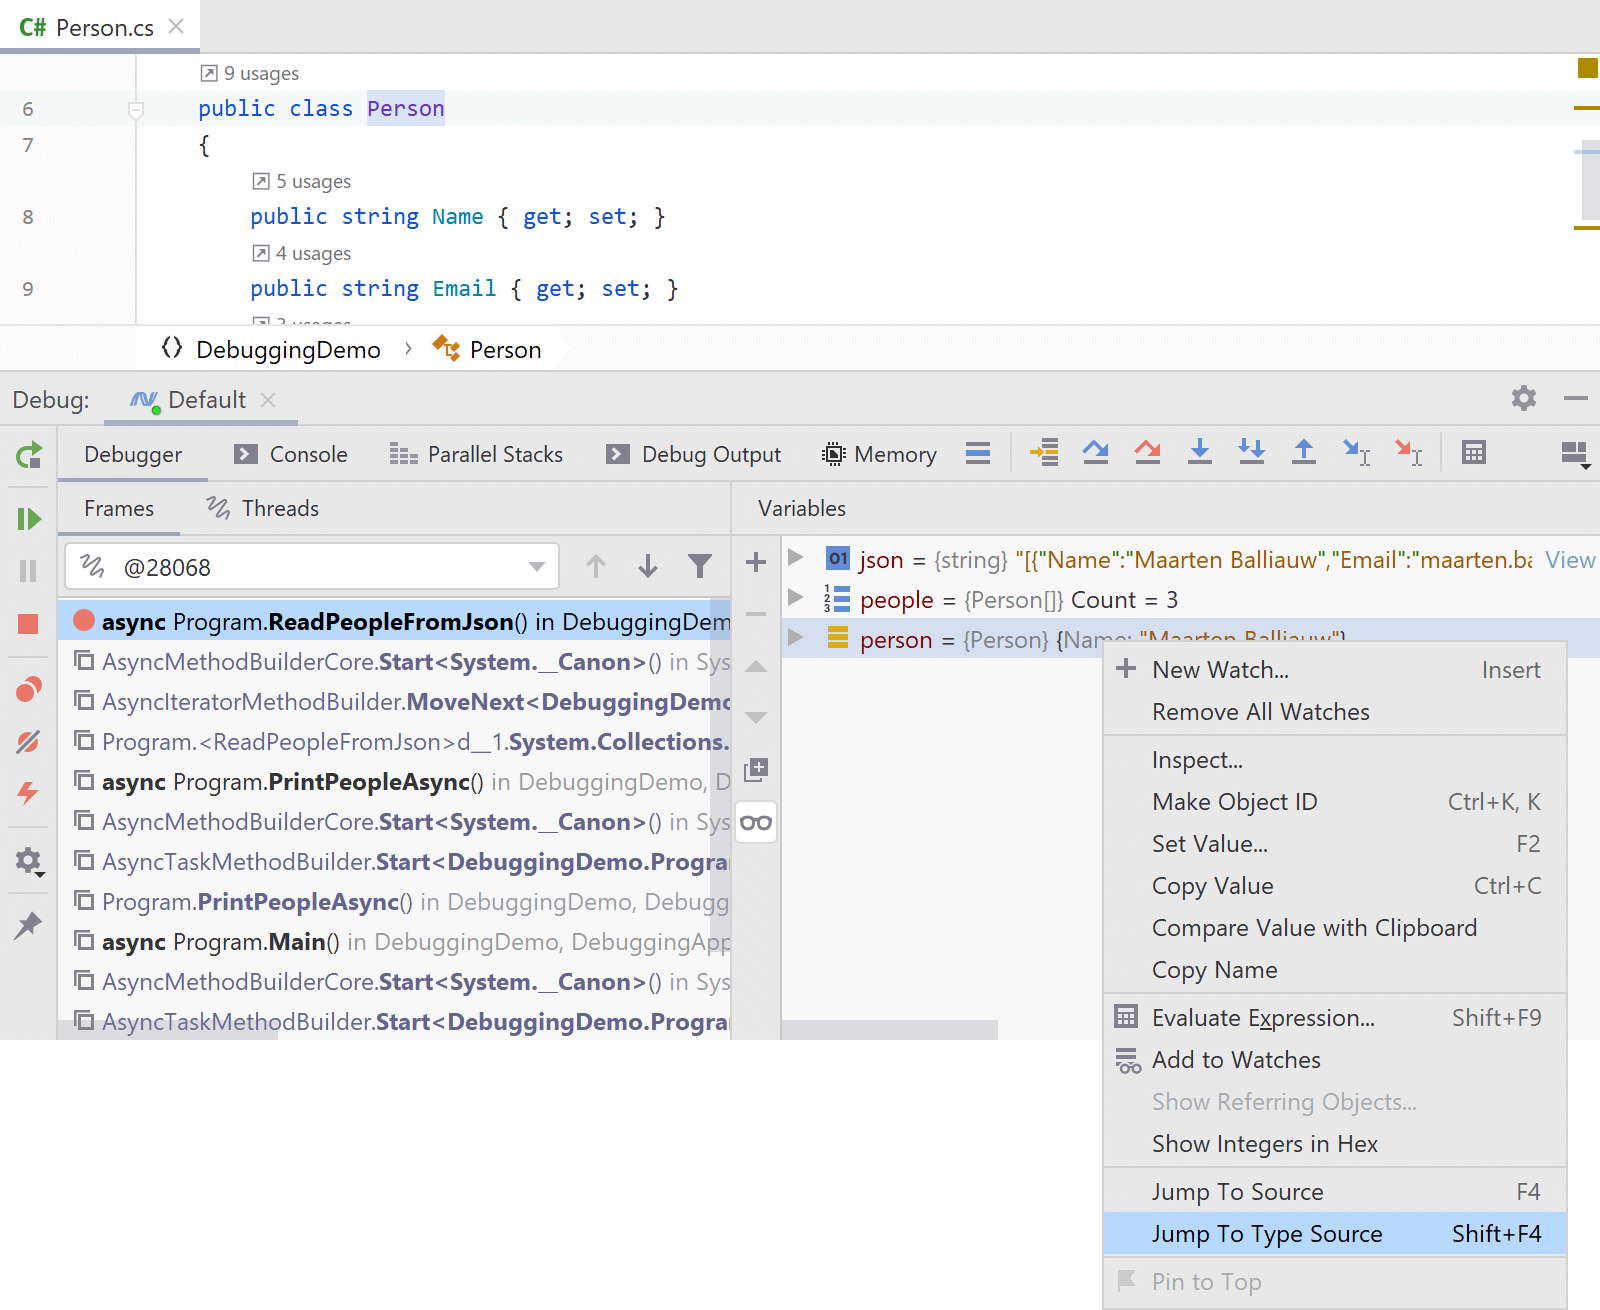
From the variables view, we can now use Jump to Type Source (Shift+F4) to quickly navigate to the type definition of the variable we are inspecting and see what it looks like in code.
We’ve also worked on making remote debugging more user-friendly, by showing notifications that describe when there are errors in the configuration, as well as adding a password and key passphrase prompt when connecting to a remote server.
Download Rider 2019.3 now and give it a try! We’d love to hear your feedback on these debugger improvements!
Subscribe to a monthly digest curated from the .NET Tools blog:


