dotMemory Support For Linux Process Dumps

Great news, Linux users! dotMemory 2021.1 now supports analyzing dumps collected using gcore and dotnet-dump for your Linux-hosted .NET applications.
In this post, we’ll explore how to use a Linux environment, Ubuntu, as our primary development environment using JetBrains Rider, take process dumps of our .NET applications, and investigate potential issues using dotMemory on Windows.
Set up the Linux Environment
We’ll be using Ubuntu, one of the more popular desktop Linux distributions for this walkthrough. Readers should feel free to use the distribution of their choice but realize that their success levels may vary based on .NET support for their particular distribution.
Whether you’re a newbie to Linux or a long-time veteran, you’ll find that it is relatively straightforward to start developing .NET applications on Linux. We recommend installing the .NET SDKs using Microsoft’s dotnet-install.sh script.
We’ll start by downloading the dotnet-install.sh file and applying a chmod to our file to execute the bash script. We can install all versions of the .NET SDK. For this example, we will only install the current version, which is 5.0 as of this post.
> chmod +x dotnet-install.sh
> ./dotnet-install.sh -c Current
Next, let’s make sure that our terminal instances can find our newly installed instances of the dotnet CLI tooling. By default, Ubuntu uses bash, so we’ll modify our .bashrc to add the new .dotnet folder to our PATH.
# dotnet
export DOTNET_ROOT=$HOME/.dotnet
export DOTNET_TOOLS=$HOME/.dotnet/tools
export PATH=$PATH:$DOTNET_ROOT
export PATH=$PATH:$DOTNET_TOOLS
We may need to restart our Terminal to access the dotnet command.
Installing the dotnet-dump tool
In the previous step, we added the .NET tools folder to our path, which allows us to run any .NET tool we’ve installed globally. To take .NET process dumps, we’ll need to install the dotnet-dump tool globally. From an instance of the Terminal application, we can execute the following command.
> dotnet install -g dotnet-dump
We can test that we’ve installed the tool properly and our environment is ready by running the dotnet dump command.
> dotnet dump
Required command was not provided.

Usage:
  dotnet-dump [options] [command]

Options:
  --version         Show version information
  -?, -h, --help    Show help and usage information

Commands:
  collect                Capture dumps from a process
  analyze <dump_path>    Starts an interactive shell with debugging commands
                         to explore a dump
  ps                     Lists the dotnet processes that dumps can be
                         collected
Let’s write a straightforward .NET application to demonstrate the workflow, although any .NET process running on a Linux host will do.
Retrieving a process dump
We’ll first need a .NET application. From JetBrains Rider, we’ll create a new Console Application project with the following code.
using System;
using System.Collections.Generic;
using System.Linq;
using System.Threading.Tasks;

while (true)
{
    Console.WriteLine(
       "The next value is {LeakingValues.GetNextValue()}.");
    await Task.Delay(TimeSpan.FromMilliseconds(100));
}

public class LeakingValues
{
    private static List<string> Values { get; } = new();

    public static string GetNextValue()
    {
        Values.Add(Guid.NewGuid().ToString());
        return Values.Last();
    }
}
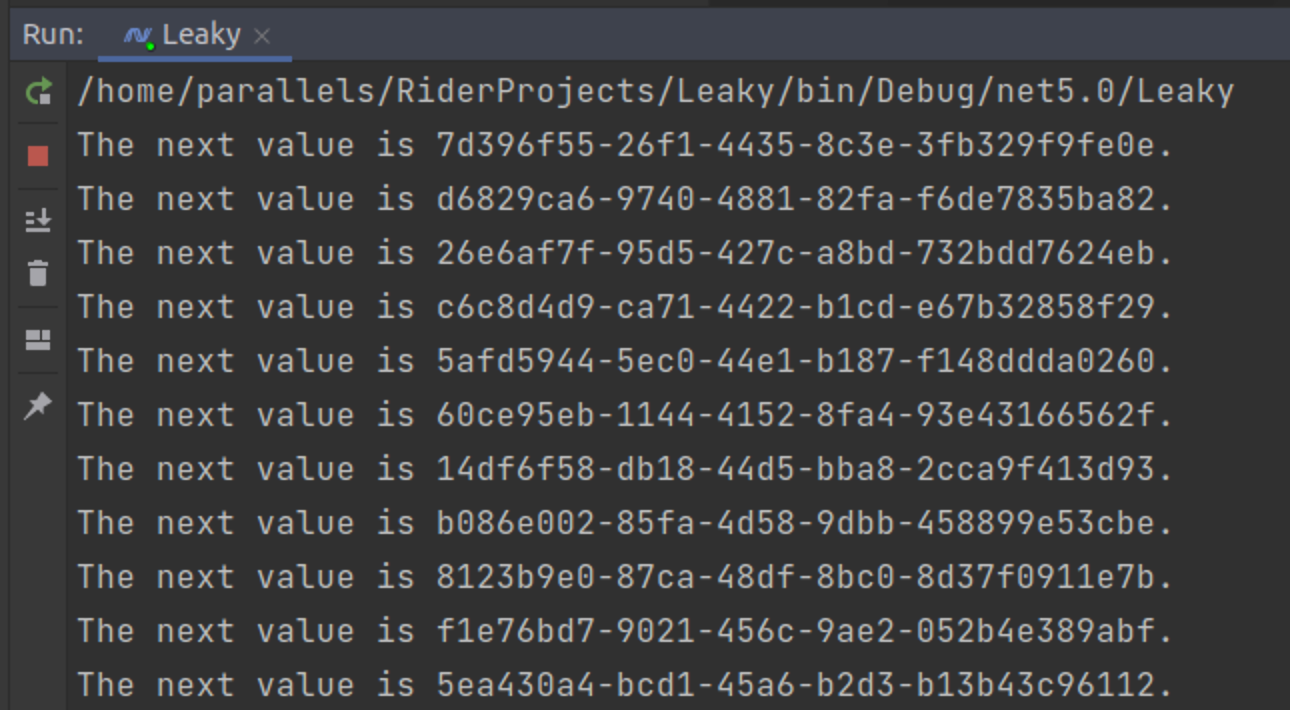
The collection of Values will continue to grow as long as our process is running. Let’s start the application and look at the results of the program’s output.
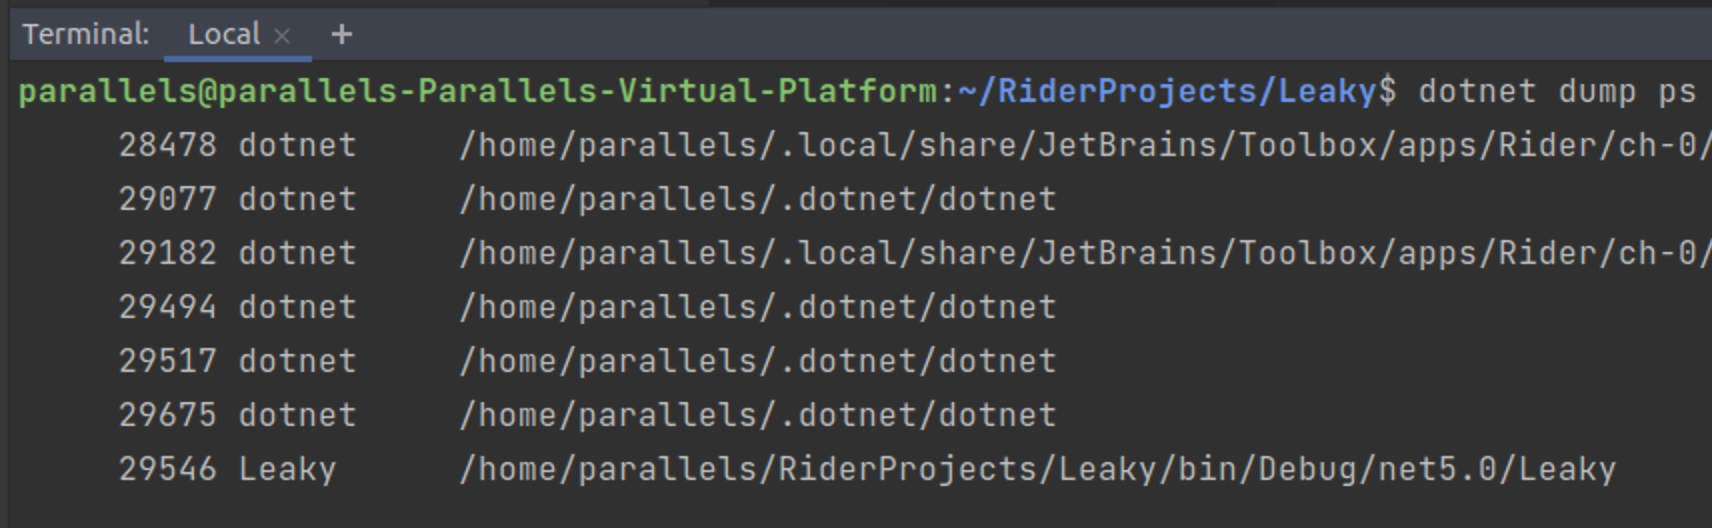
We can use the command dotnet dump ps to list all running .NET processes within our development environment.
Having identified our application from the list, we can either use the name of the process or the process id to collect a process dump using the command dotnet dump collect -n Leaky.
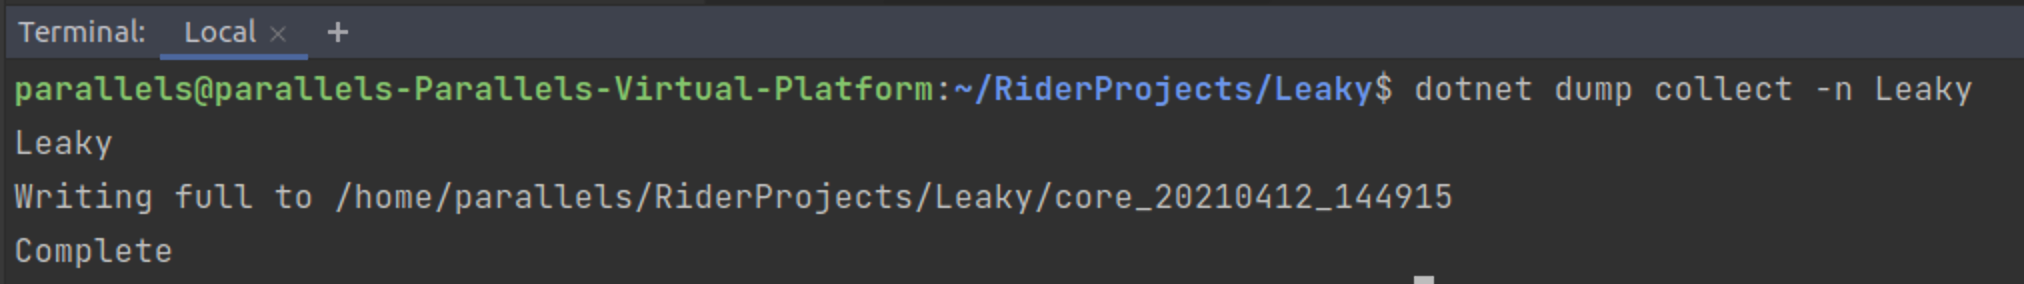
A successful process dump will yield a file on disk. In this example, the dotnet-dump tool created a core_20210412_134437 file.
Using dotMemory to read Linux process dumps
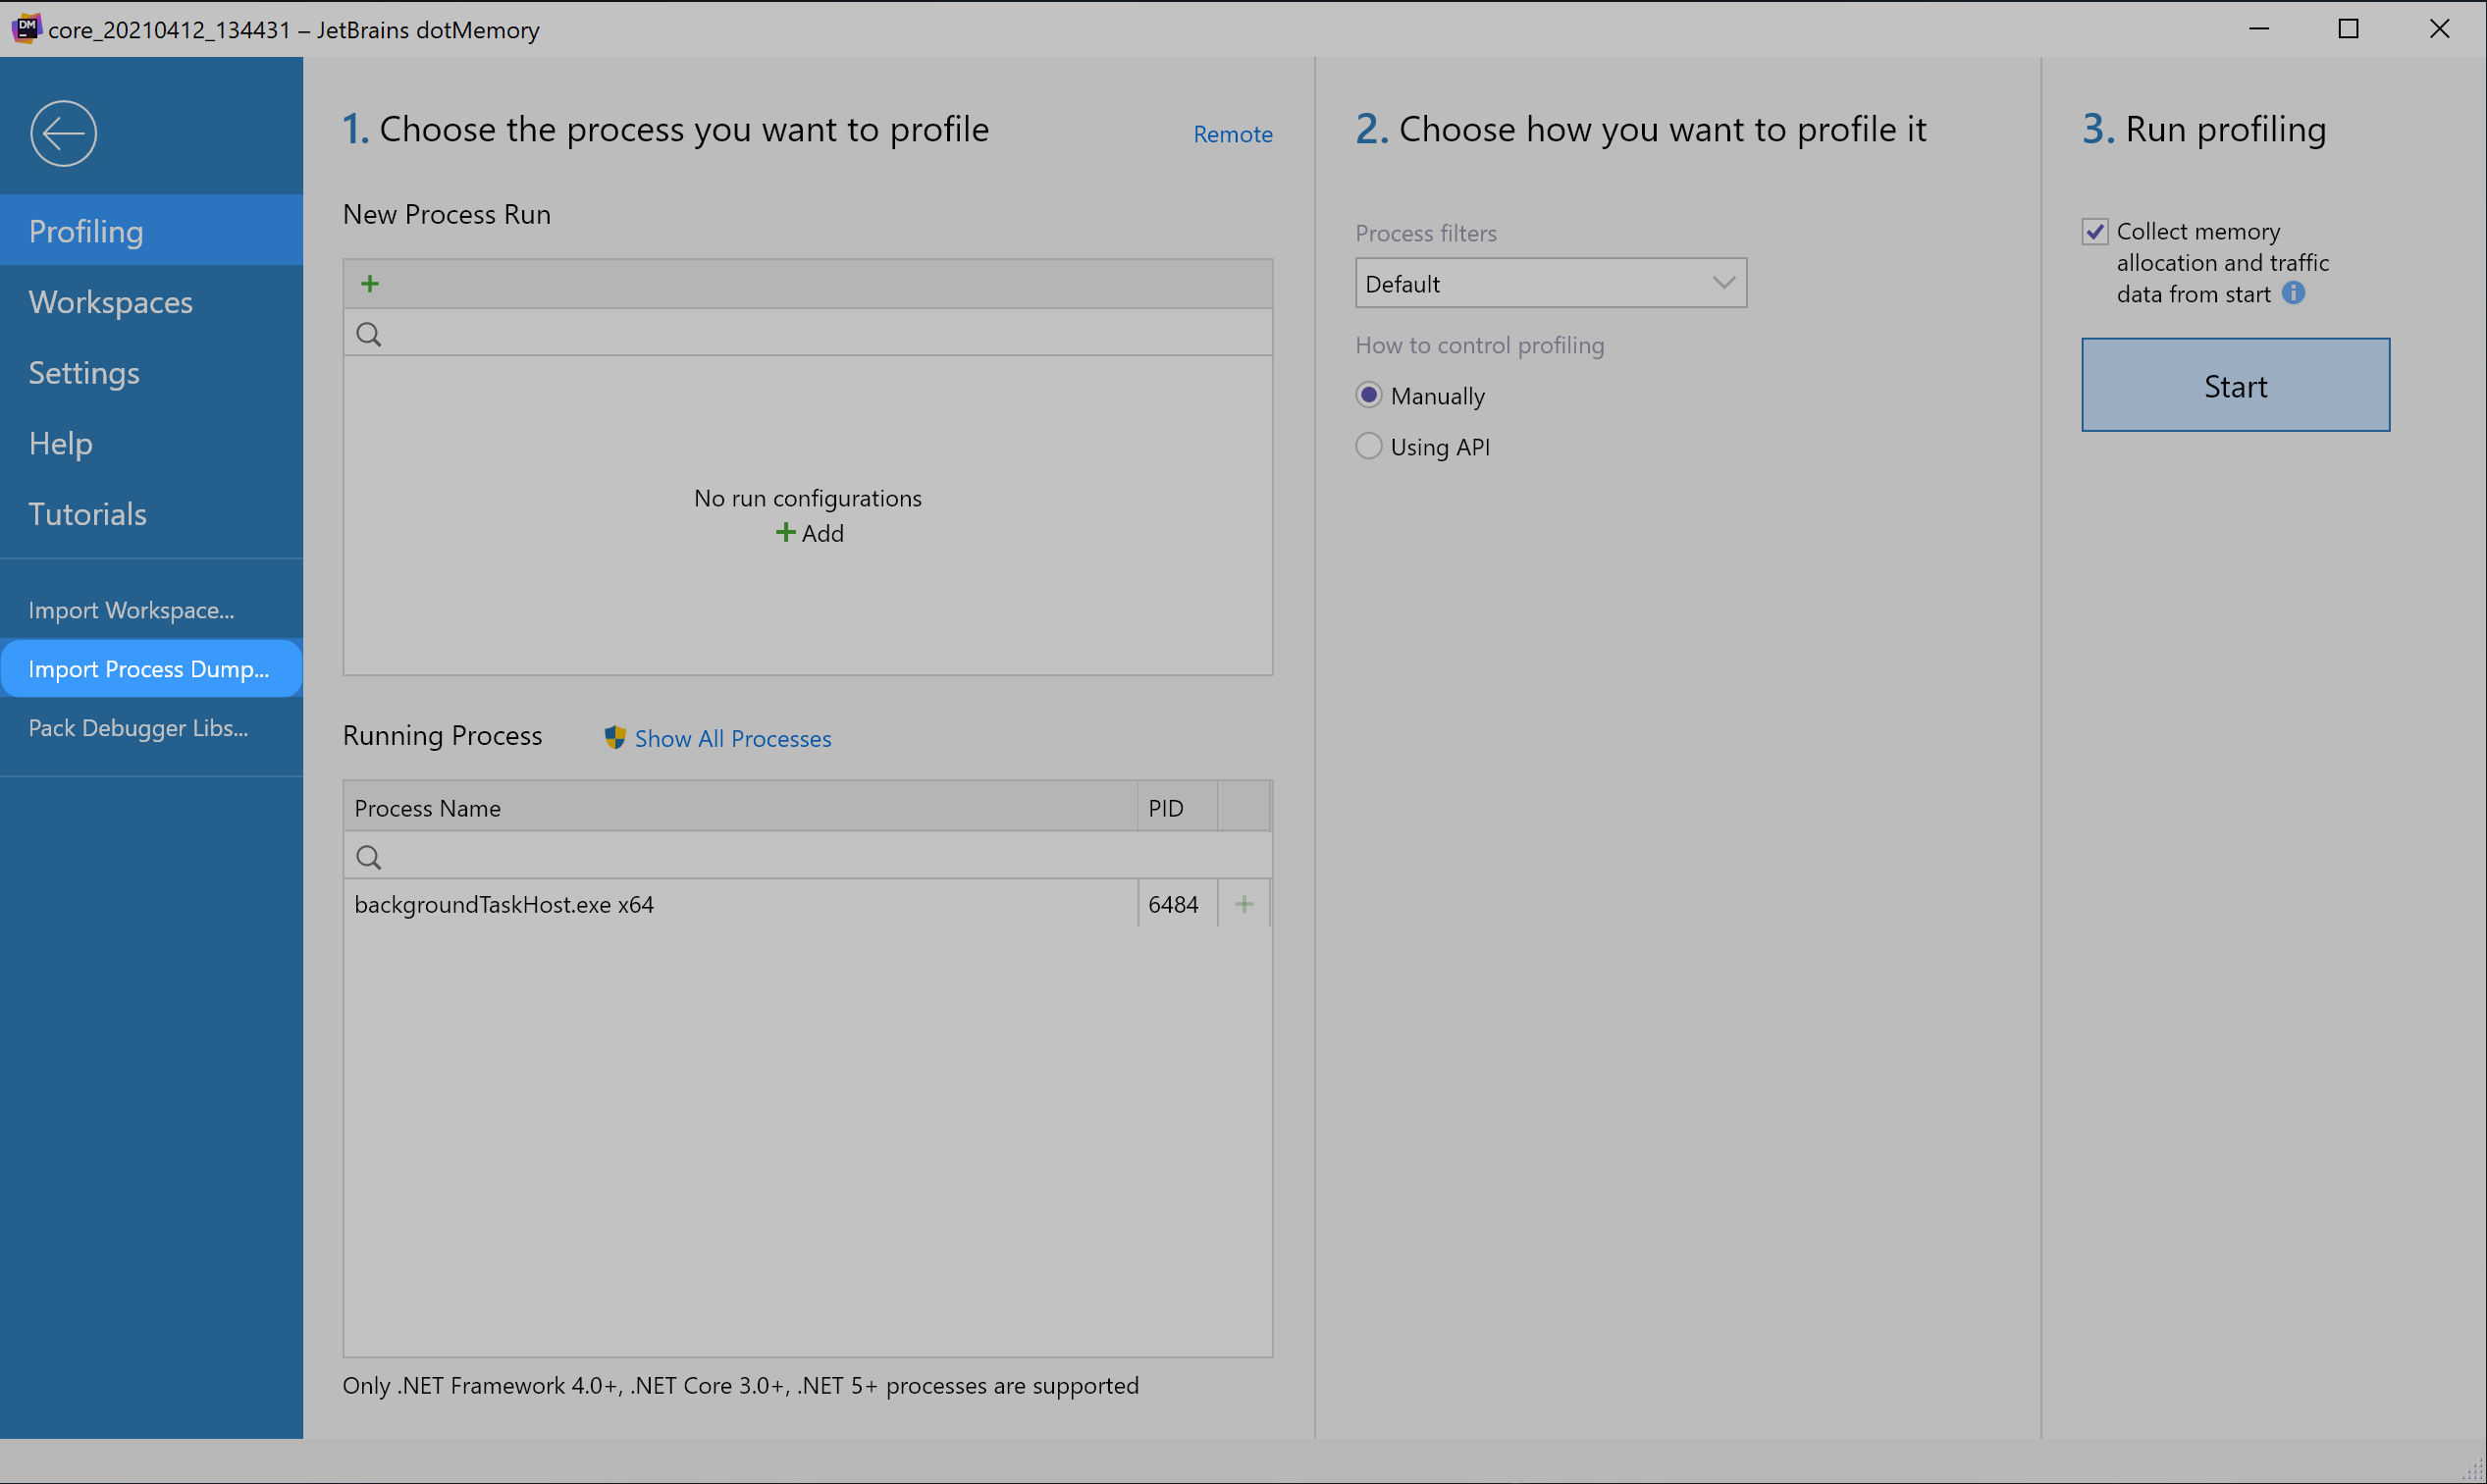
In a Windows environment, we’ll begin by opening dotMemory 2021.1. On the home screen, in the left-hand menu, we’ll find the selection of Import Process Dump… near the bottom. Once clicked, we’ll need to locate the file core_20210412_134437 generated from dotnet-dump in our Linux environment.
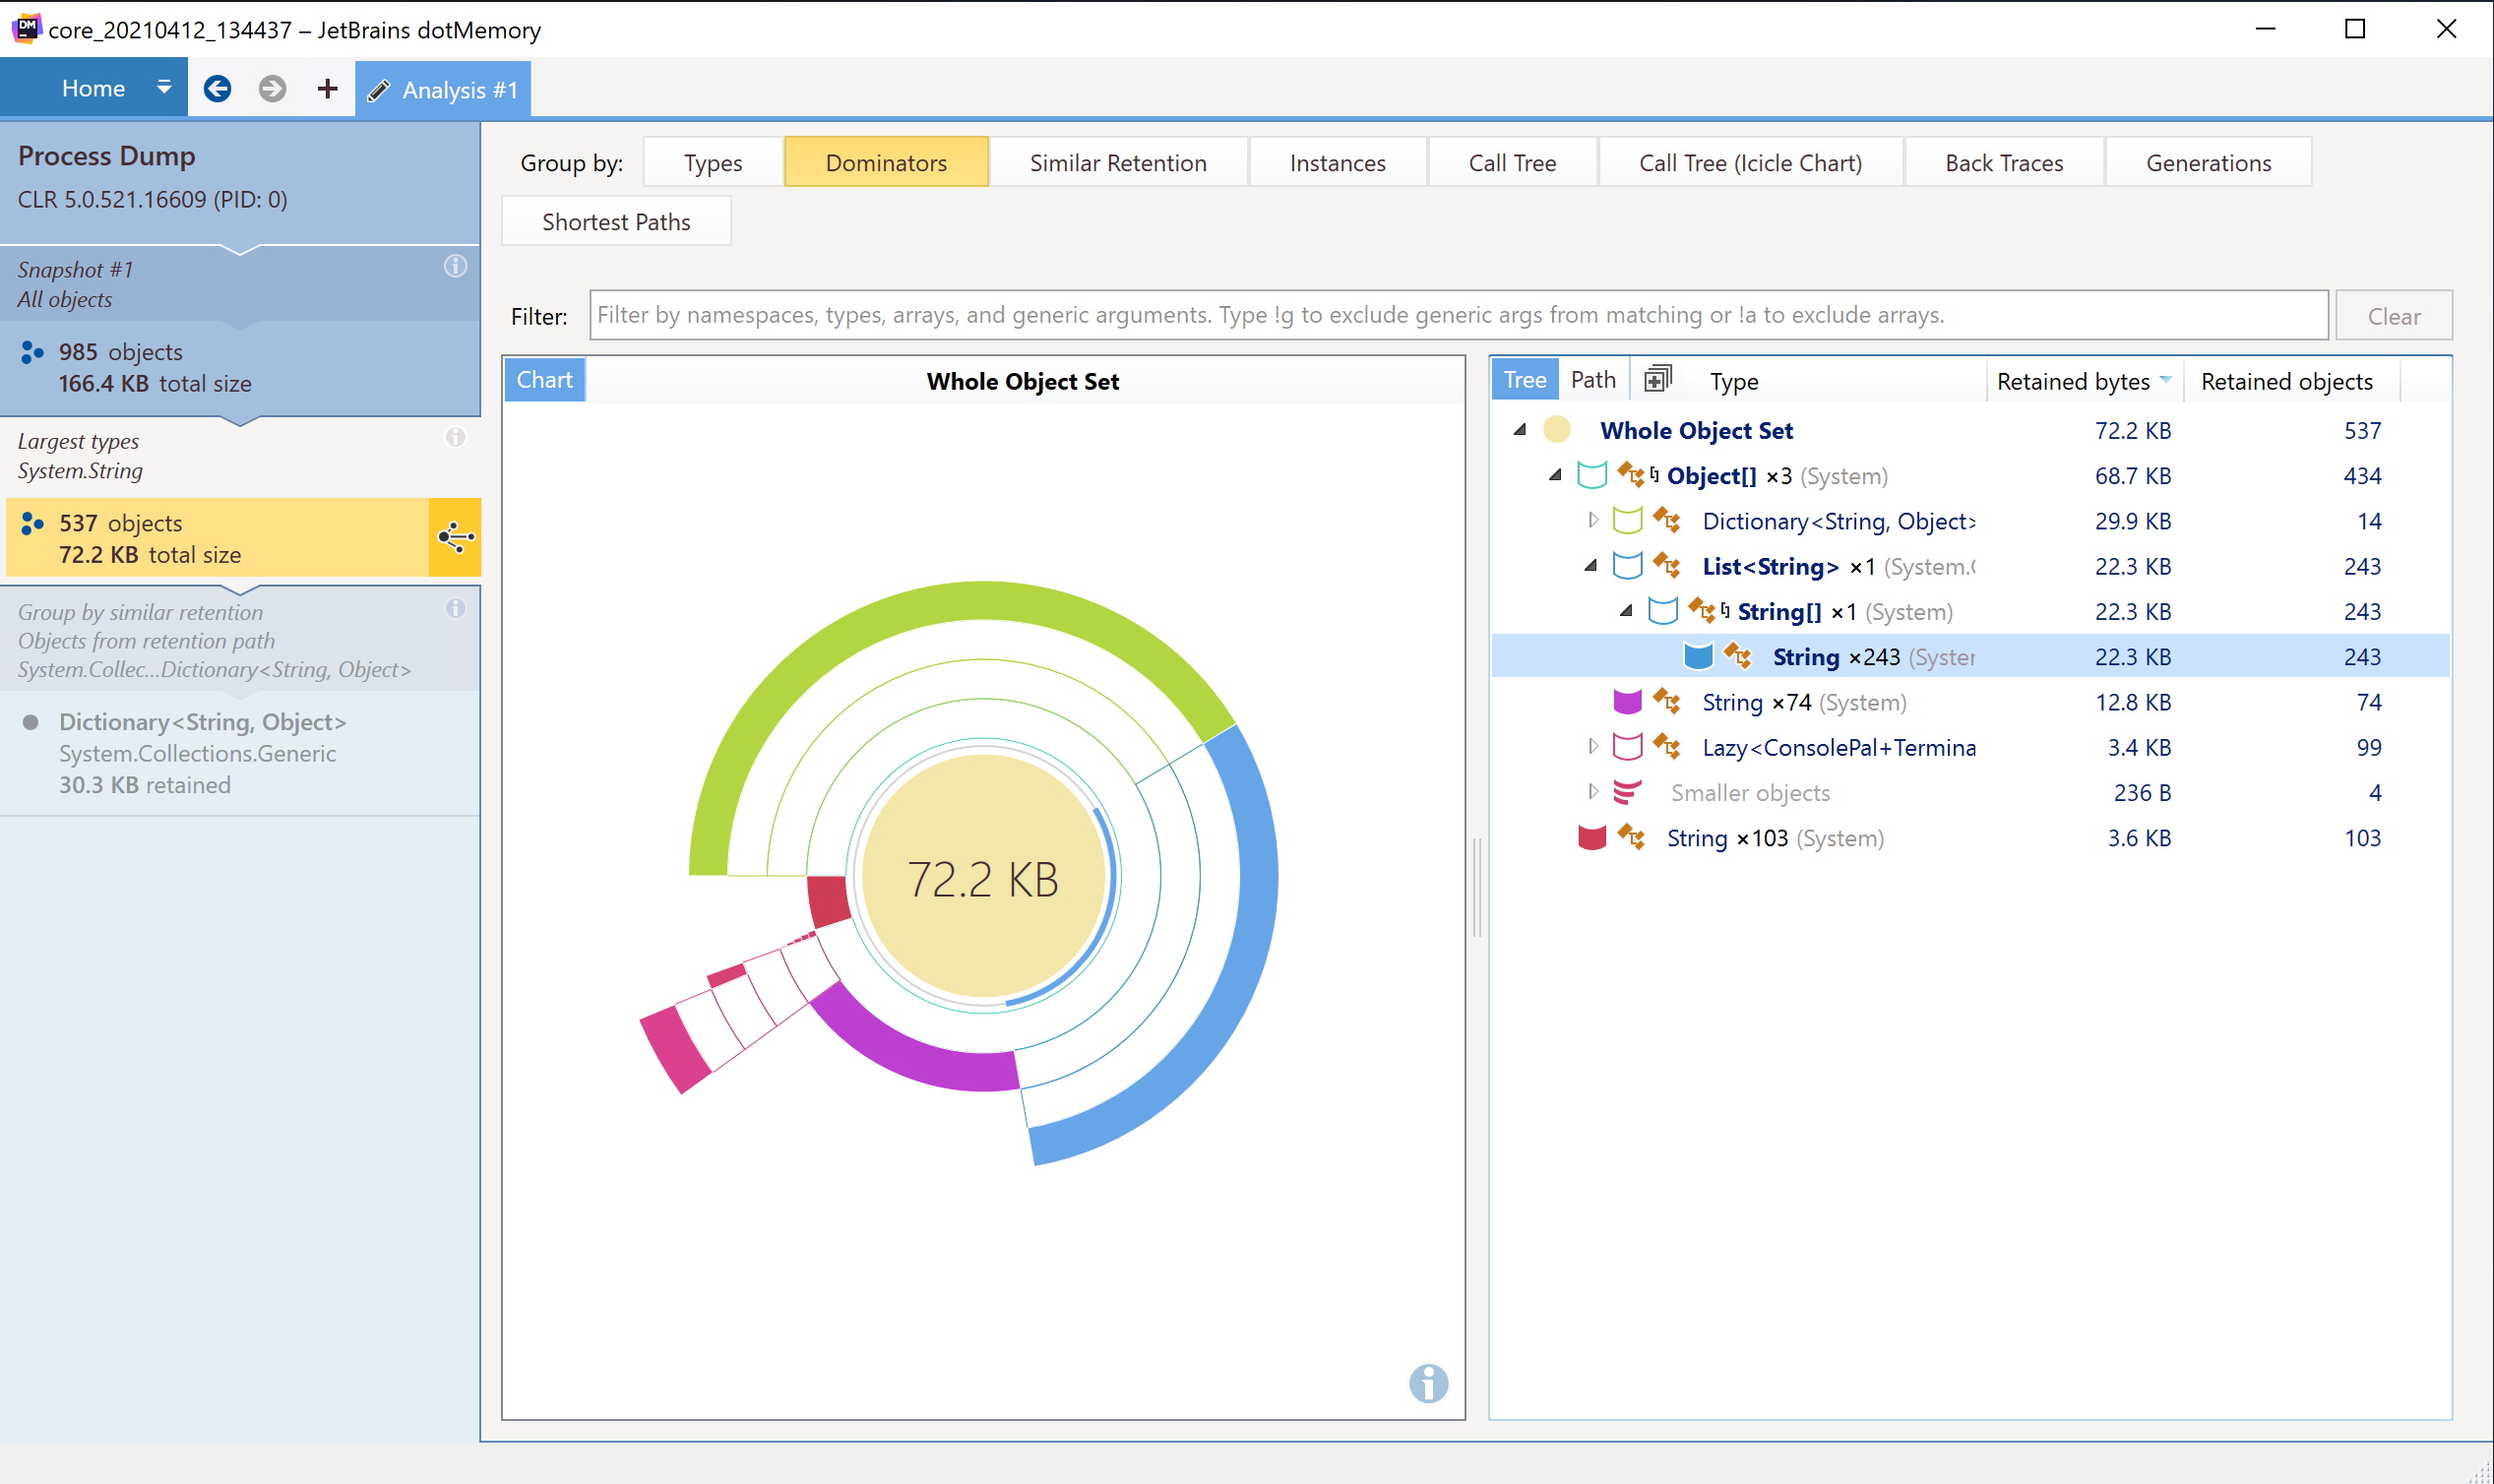
Once dotMemory has loaded our process dump, we can begin to explore our snapshot. Let’s go to the Dominators tab in dotMemory, which tells us what types the application is retaining the most. It should come as no surprise to see the List<string> collection in our LeakingValues class at 243 objects.
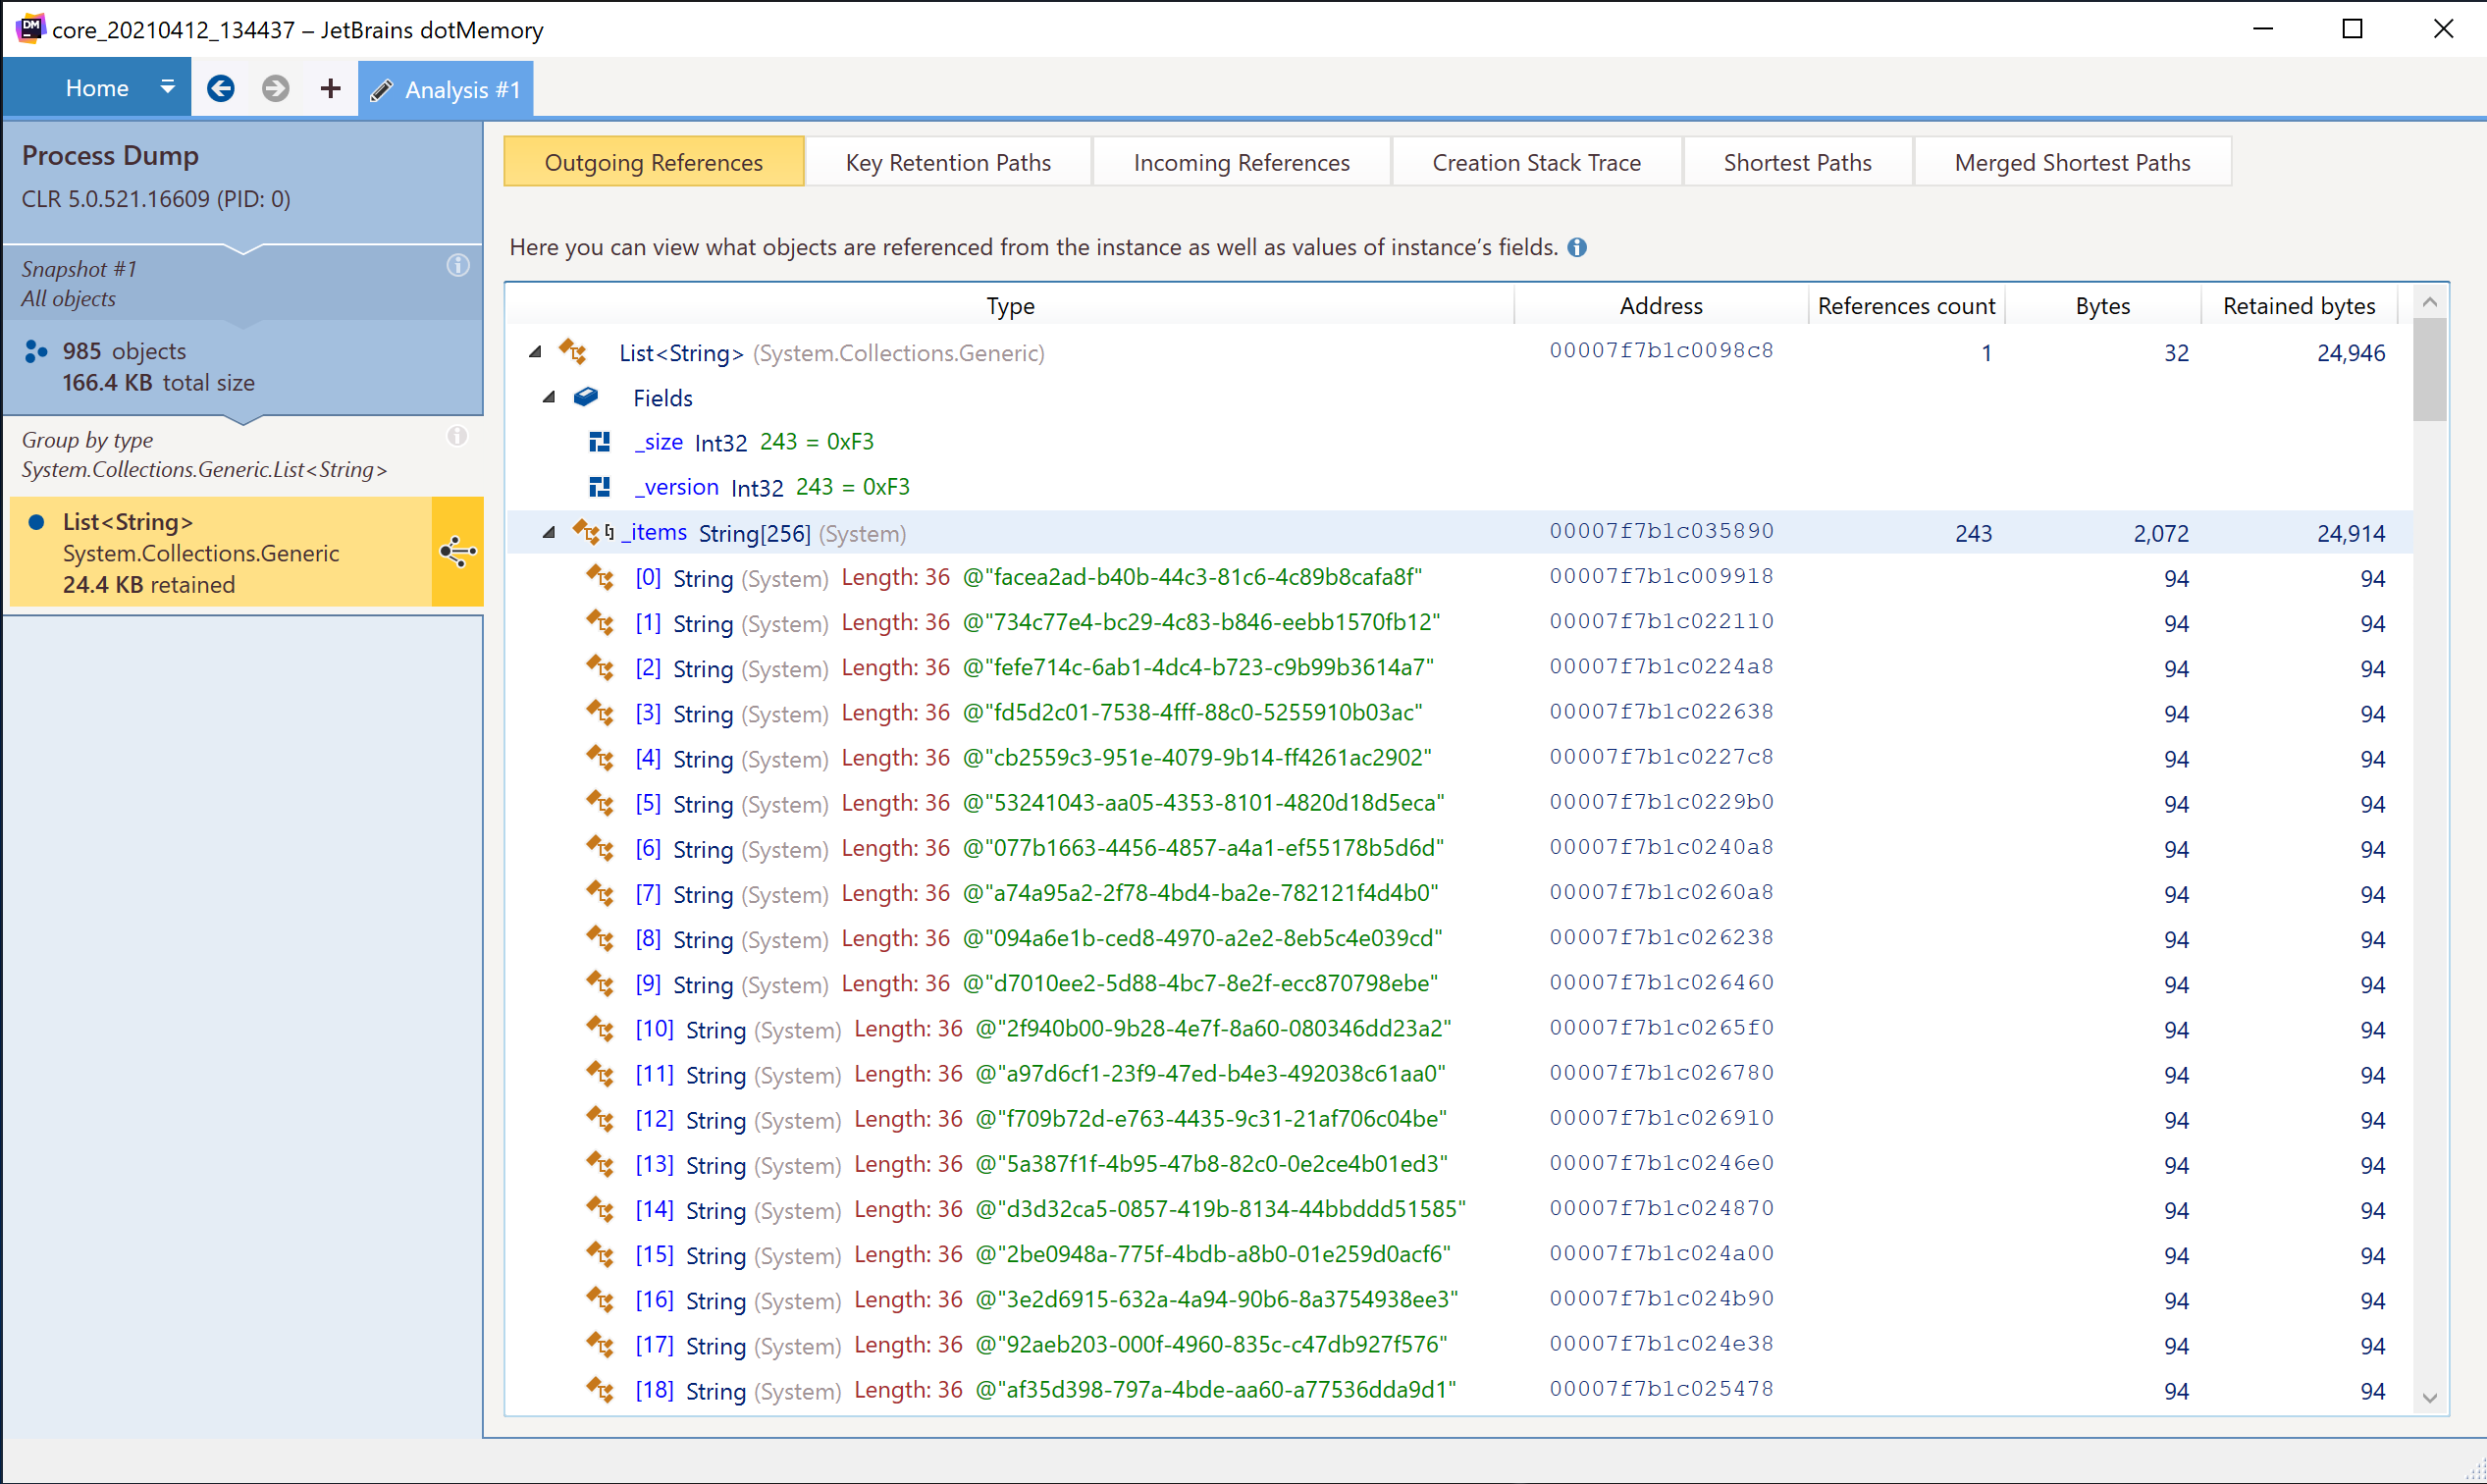
We can see the values in our List<string> instance using the Outgoing References tab. Look at all those string values!
While we could use the dotnet dump tool to analyze our process dumps within our Linux environment, the dotMemory UI is a much more intuitive and much more user-friendly experience.
dotMemory Command-Line Tools
While the dotnet-dump global tool works for production problems, we recommend using the dotMemory command-line tools whenever possible. The command-line tools allow users to collect memory snapshots in the native dotMemory workspace format of .dmw.
Some of the many advantages of using the dotMemory command-line tools include:
- Periodic snapshot triggers based on time intervals.
- Threshold snapshot triggers based on increases in memory consumption.
- Immediate snapshots on application startup for a baseline.
- Support for both .NET and .NET Core applications.
- Support for all major operating systems like Windows, macOS, and Linux.
- x86 and Linux ARM 64 architecture support.
Read more about the dotMemory command-line tool in our documentation, or download it now.
Conclusion
The dotnet-dump tool combined with dotMemory is an invaluable diagnostic method for determining an application’s behavior. Linux being the hosting Juggernaut it is, makes it essential developers become comfortable solving .NET issues running on Linux. Thankfully, we now can use the tools we know and love – dotMemory, .NET, and Linux.
We hope you found this post helpful, and be sure to try the latest version of dotMemory for your .NET diagnostic needs.
Subscribe to a monthly digest curated from the .NET Tools blog: