Template Debugging

In April we had a webinar about Visual Debugging. I misfired at the end, when showing template debugging in web frameworks, and promised a do-over.
Here’s the do-over…let’s talk about a wonderful and useful feature in PyCharm Professional: breakpoints in templates. PyCharm’s visual debugger is a killer feature, usually the highest-rated feature in our IDE. PyCharm can put breakpoints not just in Python code, but in Django and Jinja2 templates.
Let’s take a look at PyCharm Professional template debugging in Django, Flask, and Pyramid. In this blog post, I’m using the latest stable release, version of 2017.1.3.
Django Template Debugging
Let’s start with a simple sample project using a Django cookiecutter. We’ll start the Django server using the debugger. Note: I’m on macOS so I previously clicked the debugger console link to compile the Cython speedups for this Python version.
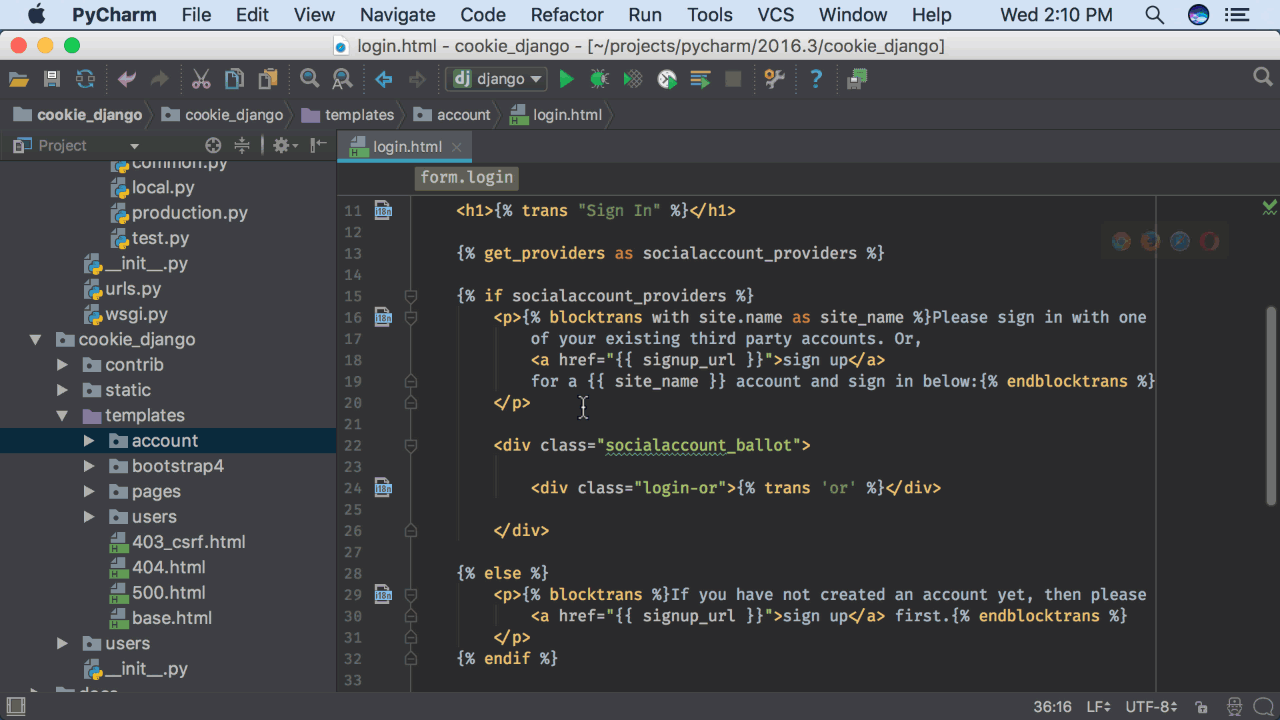
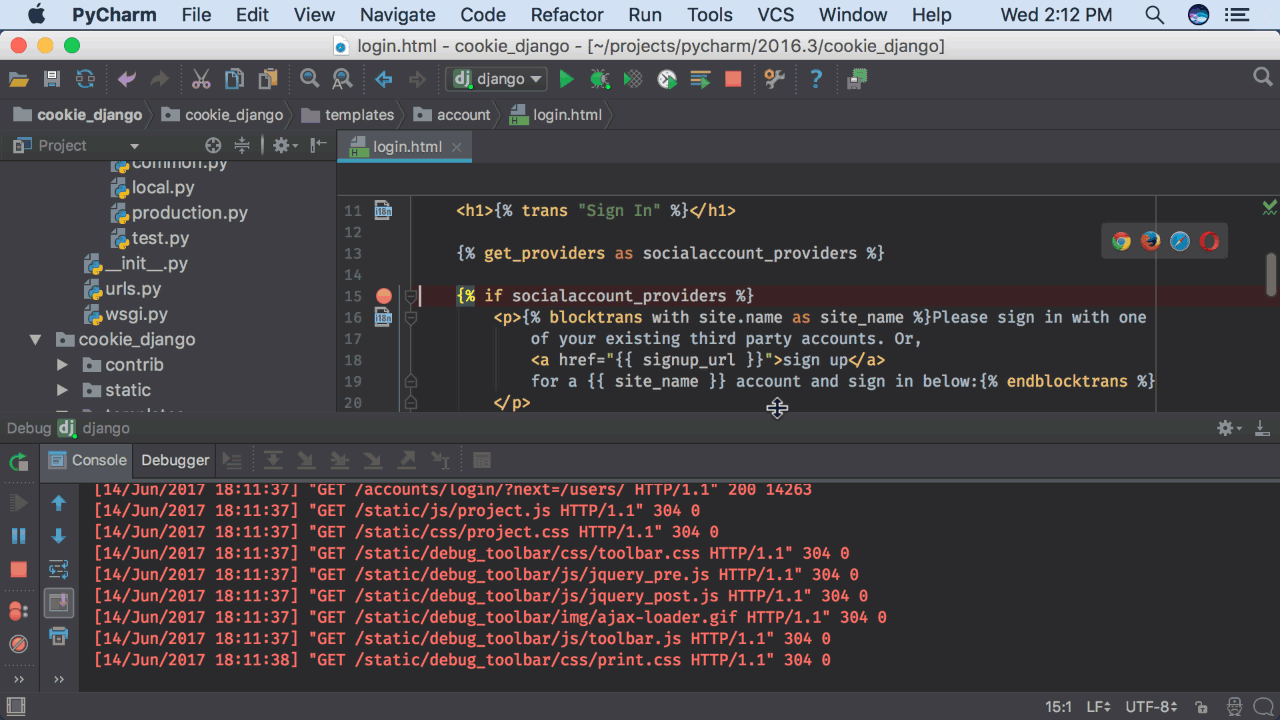
With Django now running under the debugger, let’s set a breakpoint in one of our templates, to inspect the value of socialaccount_providers:
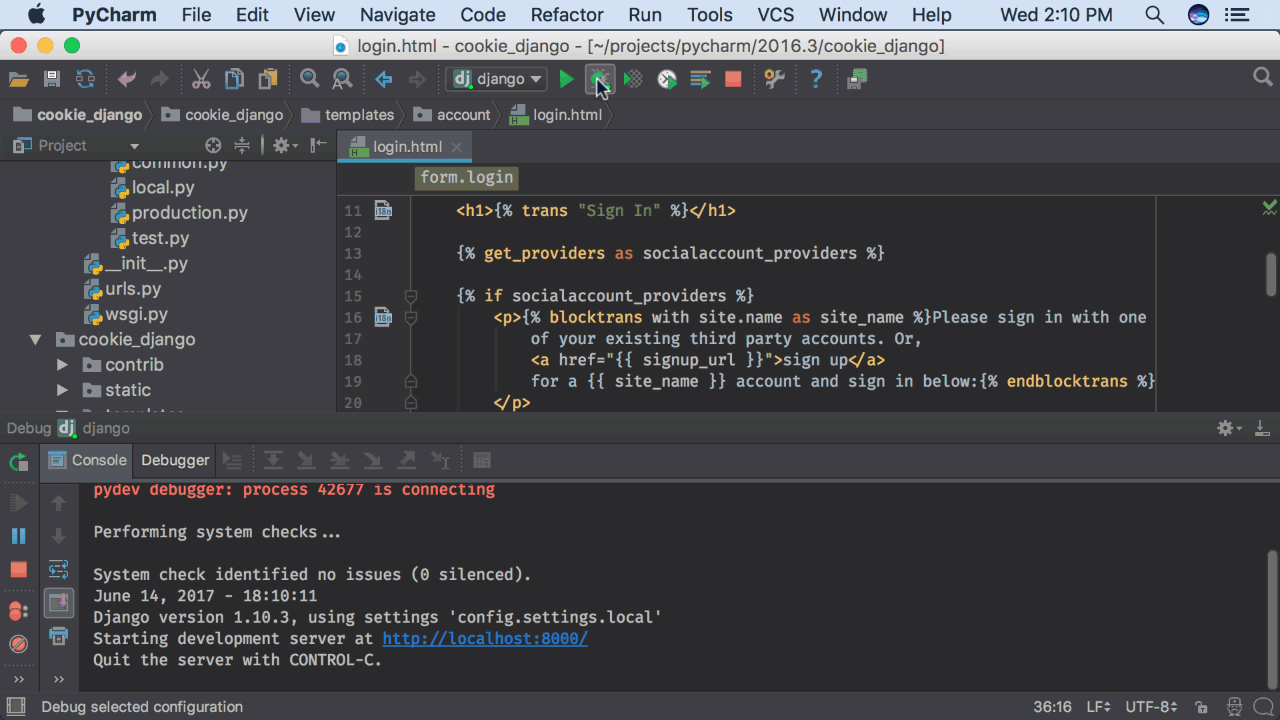
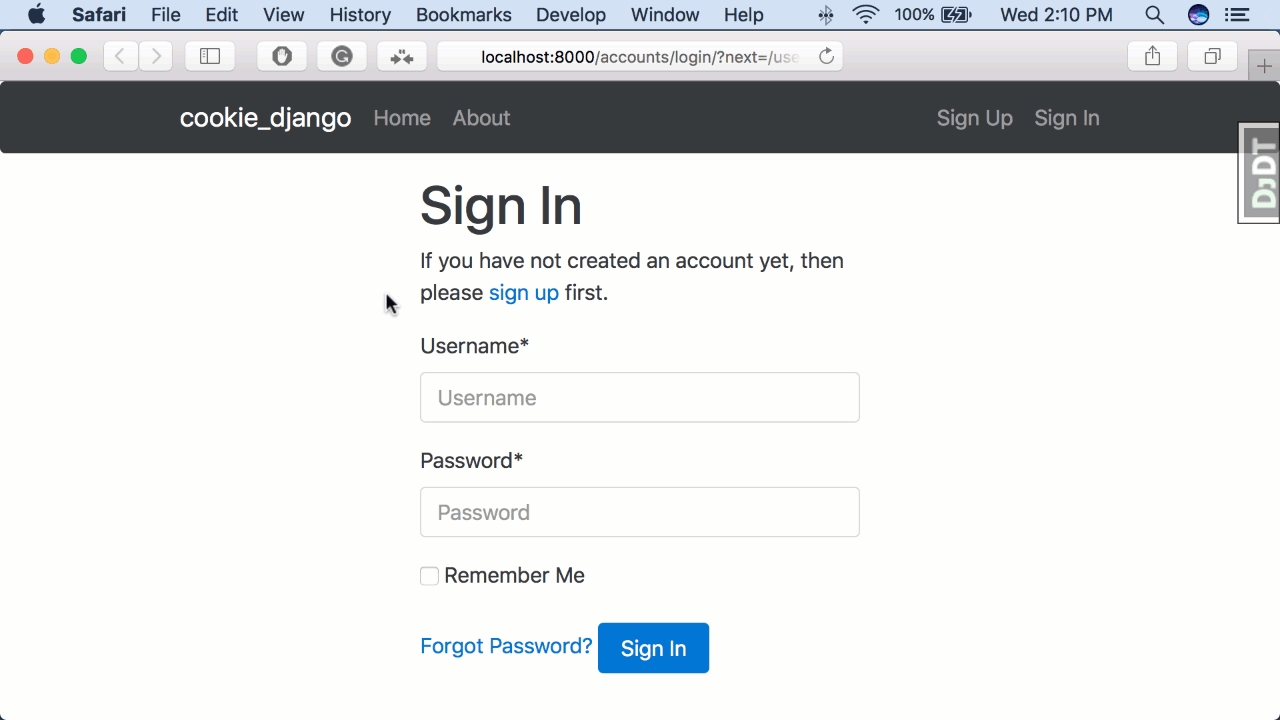
Reloading the page now pauses execution on that line of the template. We can view all the variables in scope, with all the other debugging features, just like regular debugging:
It’s important to make sure PyCharm knows the template language used in the project. If this isn’t set correctly, template debugging won’t work. Let’s confirm that this project uses Django templates:
Flask Template Debugging
Flask uses Jinja2 for its template engine, and PyCharm Professional supports debugging Flask templates in Jinja2. We again have a simple Flask todo project which we’ll start under the debugger:
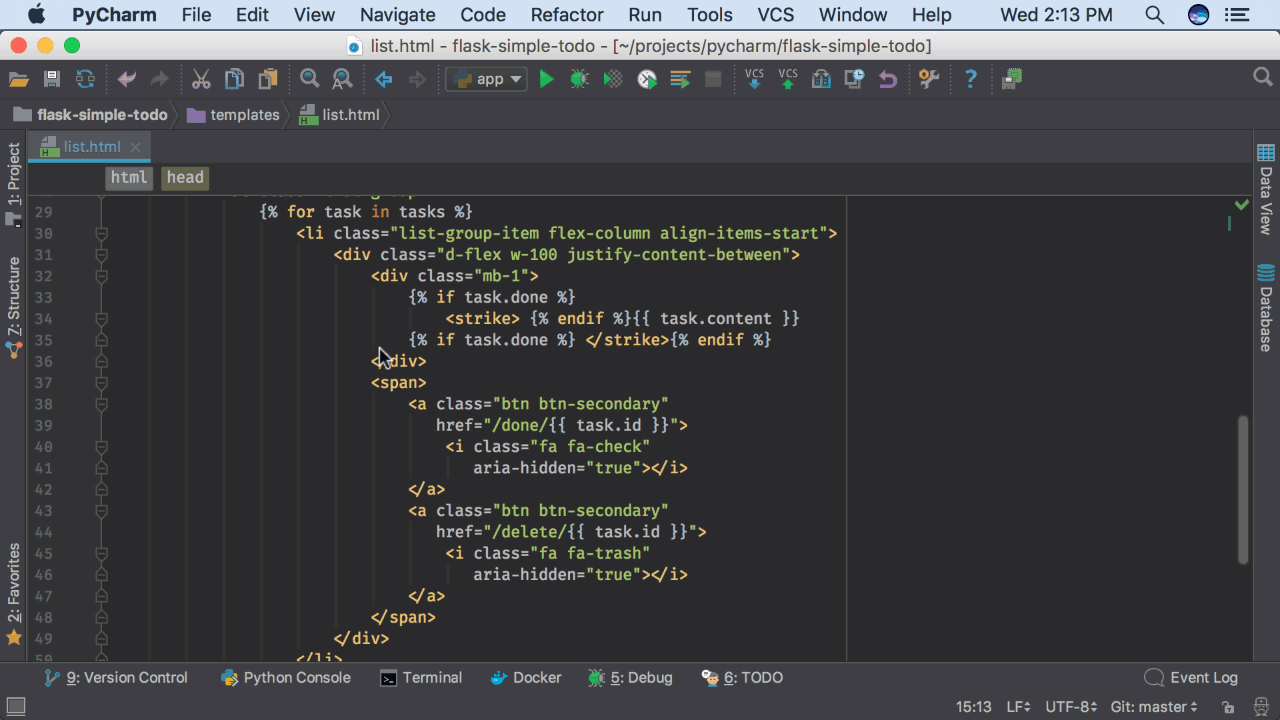
Setting a template breakpoint is similar to Django:
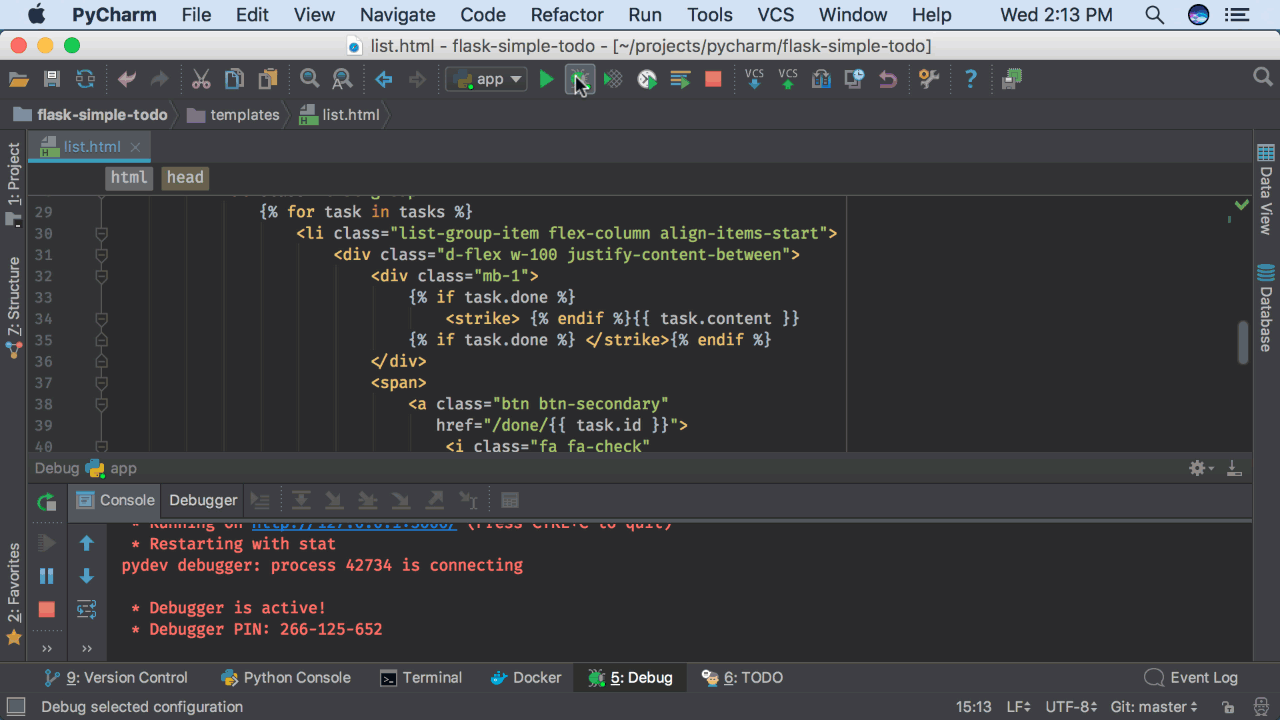
When we reload our todo list, PyCharm Professional stops execution on that line in the template:
As explained above, we need to ensure this project uses Jinja2 as its Python Template Language:

Pyramid Template Debugging
For completion, PyCharm supports other web frameworks such as Pyramid, and the process is the same. We run the Pyramid server under the debugger:
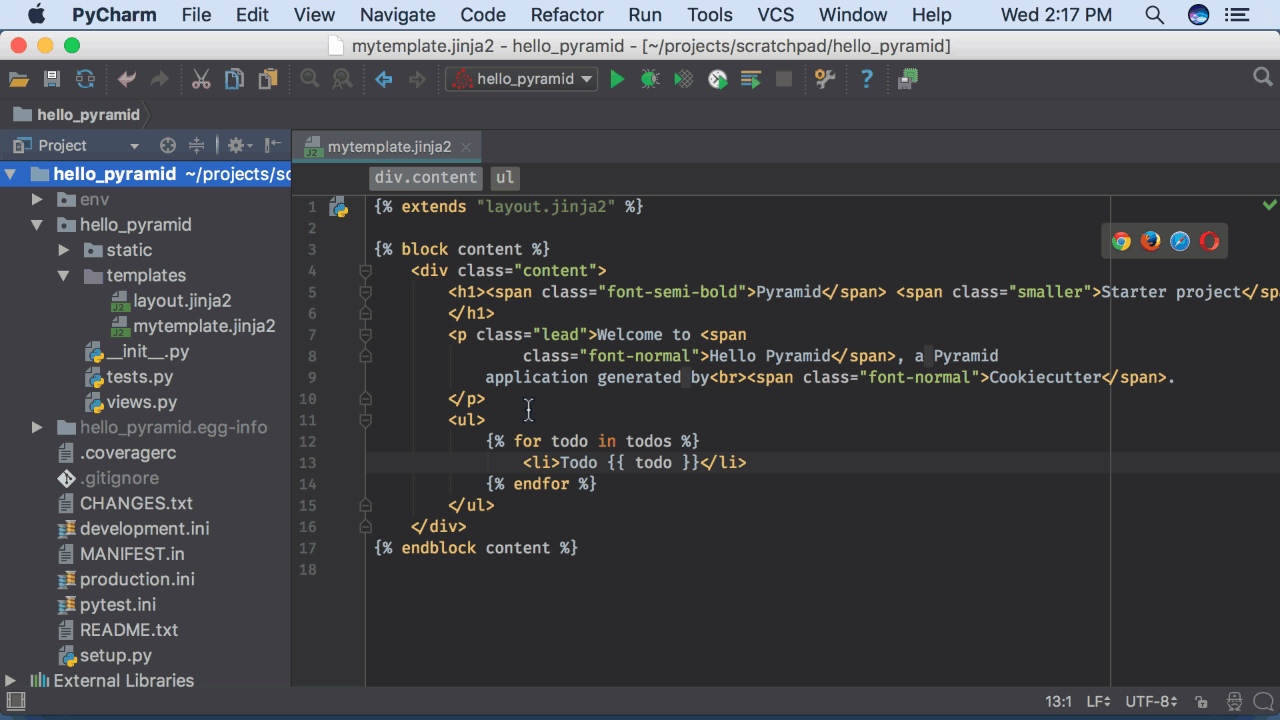
This is a Jinja2-based Pyramid project which means we can set breakpoints in templates:
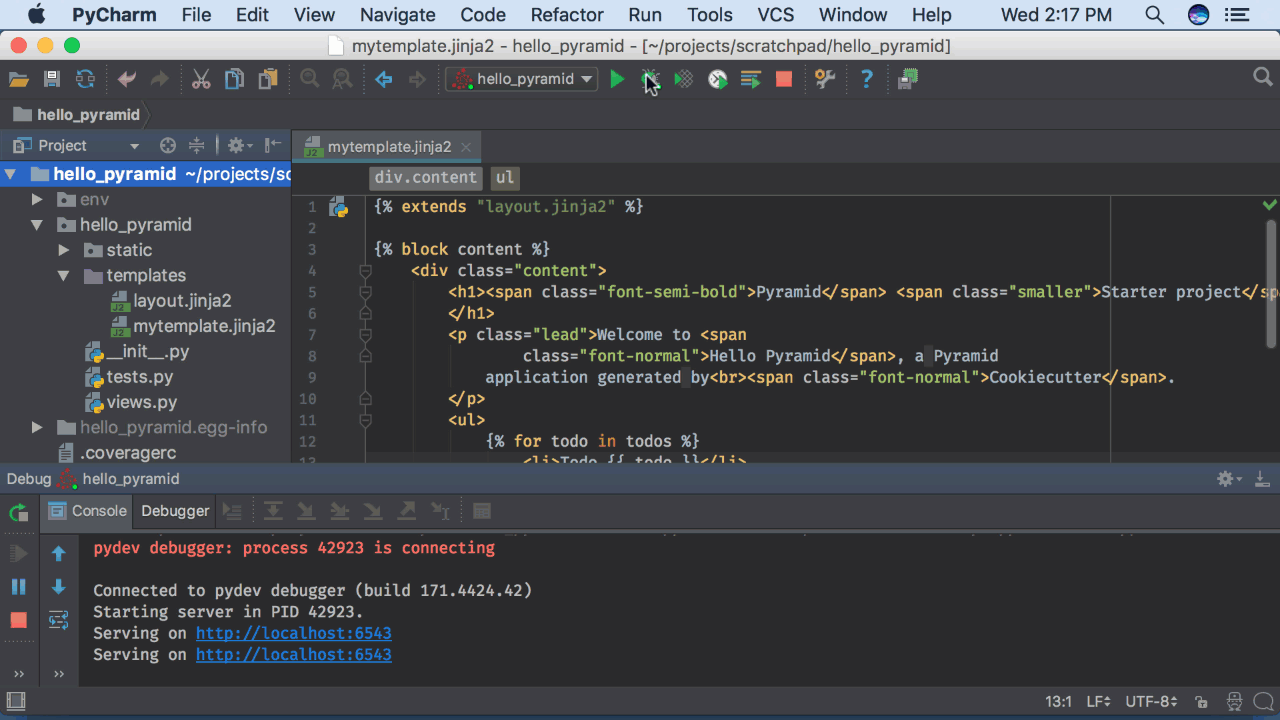
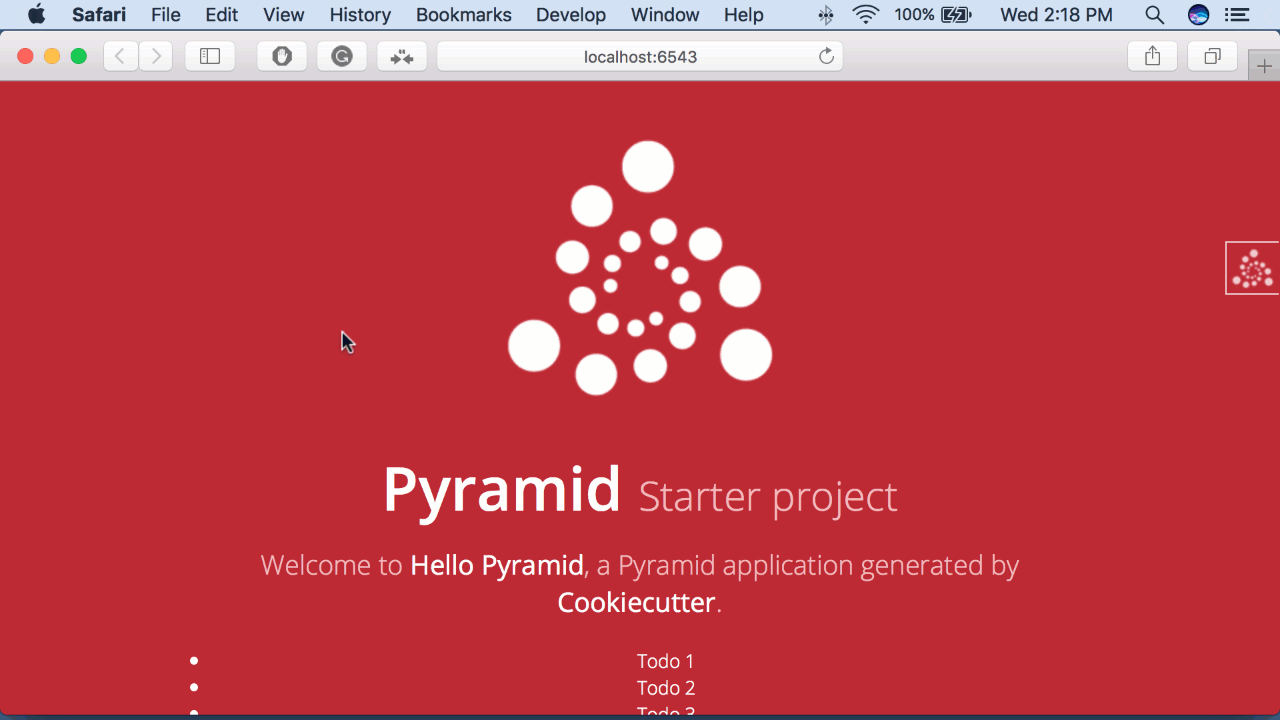
Again, reloading the page stops the Pyramid request execution at the breakpoint in the template:
As a note, Pyramid has first-class add-on support for Jinja2, Chameleon, and Mako, but PyCharm’s template debugging is restricted to Jinja2 (and Django). Also, Jinja2 template debugging isn’t restricted to web frameworks: you should be able to set breakpoints and debug templates in a non-web Python application.
Wrapup
The webinar showed many of the powerful, productive features in “Visual Debugging”: breakpoints, stepping, watches, etc. These features apply as well to template debugging. In this blog post, we showed the first steps needed to apply visual debugging to templates.
If you have any questions, please ask in the comments below. We’d love to hear from you.

Subscribe to PyCharm Blog updates