December 26, 2005
Comments now enabled and working
I have just fixed a number of problems with the comment blacklist system and re-enabled comments on all posts related to IntelliJ IDEA. So if you would like to comment on something and thought that posting to a newsgroup or Web forum was too much effort, you can now express your opinions right here on this blog.
December 23, 2005
Exception processing and Exception Analyzer
After the release of IntelliJ IDEA 5.0, from time to time we receive feedback telling us that IntelliJ IDEA 5.0 is less stable than the previous versions, that the exception reports submitted by users are now ignored, that we’re not paying adequate attention to the product quality, and so on. As quite a lot of time of the team during this and past week was spent on fixing bugs for the IntelliJ IDEA 5.1 release, I think that now should be a good time to explain the system we have recently set up for processing exception reports.
First of all, a very important thing to note is that in all versions of IntelliJ IDEA before 5.0 the exception reporter was disabled in release builds. Because of that, in previous versions the users simply didn’t see the crashes – some operations failed, or some analysis produced incorrect results, silently. In the new version, we’ve become sufficiently confident of the product quality to enable the exception reporter in release builds, not afraid of being overwhelmed by the number of reports.
To help us deal with the exception reports we’ve been getting, we decided to create an internal tool called Exception Analyzer. The current version of Exception Analyzer was mostly developed by me, so that’s one more chance for me to tell about my own work. :-)
The main concepts of the Exception Analyzer are “problem” and “report”. A problem is, essentialy, a bug in IDEA or in some other code (for example, JDK) which causes exceptions to appear, and a report is an occurrence of a problem at a user’s machine which has been submitted to us. Our old tracker didn’t have this distinction: every report became a separate bug, we often got different instances of the same problem assigned to different developers, and marking them as duplicates required a lot of manual work.

The Exception Analyzer consists of two main components: a server-side component which keeps a database of problems and reports and processes newly submitted reports, and a plugin for IntelliJ IDEA which can be used to associate new reports with problems and to investigate the reported problems. The components communicate via the SOAP protocol.
The old IDEA ITN tracker is currently used solely as the receiver and storage of problem reports. This allows us to keep the existing submit system and to process reports from versions of IDEA released before the Exception Analyzer was created. Exceptions in ITN are currently never resolved or otherwise processed; the real activity happens elsewhere.
When a new report is submitted to ITN, the Exception Analyzer first unscrambles the stacktrace, based on the scrambling map of the build in which the problem occurred. Then it checks if it matches the signature of an already known problem. If it does, the report is automatically linked to the problem, and the user receives a comment with a link to the JIRA issue describing the problem.
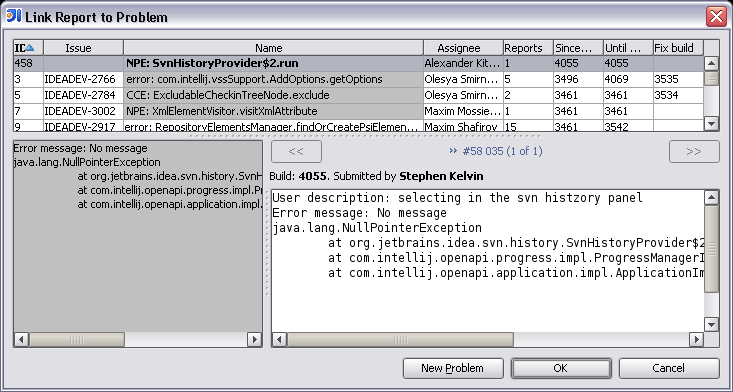
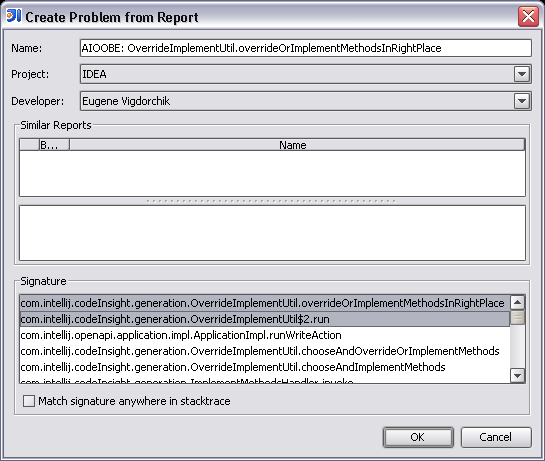
If the report is not recognized, it is shown in the “New Reports” view of the IDEA plugin, waiting to be reviewed by a developer. Developers regularly review the new reports, create new problems if the reports are indeed something new, and assign the problems to developers. As soon as a problem is created, a JIRA request is created to track the problem status and resolution, and the link to the request is sent to the user. Also, a signature (part of stacktrace) can be specified for a problem, so that other reports containing the same stacktrace fragment are linked to the same problem. Other new reports matching the signature can be automatically linked to the problem. The JIRA activity related to exceptions is tracked in the jetbrains.intellij.jira.idea.exceptions newsgroup.
Currently the Exception Analyzer is created as an internal tool, hard-coded to work with our database and project structure, but we have considered including this functionality in the team server in some way or another. The decision on this topic depends on how much interest there is in this functionality, so if you would like to use a similar tool for your own project, feel free to contact us and tell us about your requirements.
December 14, 2005
IntelliJ IDEA 5.1: Making plugin development easier
One of the most common issues raised by our users (for example, in a recent discussion of the Demetra roadmap on theserverside.com) is that developing plugins for IntelliJ IDEA is too hard. We do hear the feedback, and one of the things we did in response to it was gathering all relevant information for plugin users and developers in a single easy-to-find location on our Web site. Today I’m going to describe some of the improvements in IntelliJ IDEA itself that we’re doing to make it easier to develop plugins. Part of these improvements is already available in the IntelliJ IDEA EAP build 4069, and others were checked in by me just a few minutes ago and will be included in the next EAP build for IntelliJ IDEA 5.1.
The improvements I’m talking about provide a very easy way to create new application, project and module components, and (after my today’s changes) actions. The development of almost every plugin starts with creating a component of one of those types, and previously it was necessary to create a class and then manually register it in the plugin.xml file. Now this has been automated.
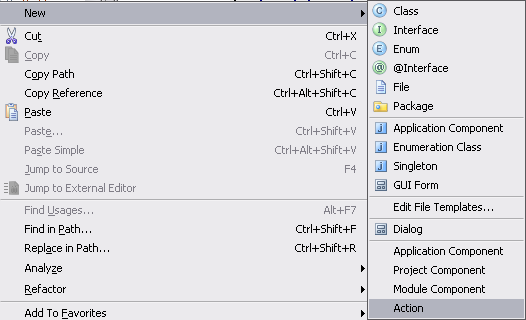
Selecting one of the new menu items which are available in plugin modules automatically creates a correct component class (from a configurable template) and adds registration for the component to plugin.xml.
For actions, it is also possible to specify the essential parameters in a dialog:
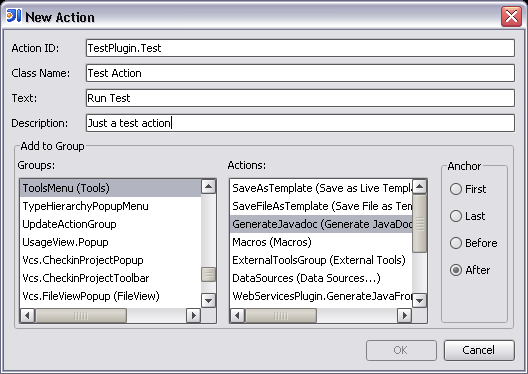
The greatest value provided by the dialog shown above is probably the possibility to browse the action group structure. Previously it was necessary to search for the action ID in the IdeActions class, or if the action is not present there, in the ActionManager.xml file which can be found deep in the resources of IDEA. Now you can easily view the list of all groups to which plugin actions can be added. When a group is selected, you can also choose the action before or after which the new plugin action should be placed.
Another related feature worth noting (also added in build 4069) is the possibility to automatically generate externalization code for plugin components which need to store their settings between runs of IDEA.
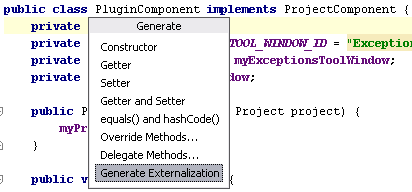
The action will change the component so that it implements the JDOMExternalizable interface, and delegate the serialization implementation to the DefaultJDOMExternalizer class.
And this is not the end - we have some more ideas on making it easier to start developing plugins, and we’re also working to provide more documentation and introductory articles for plugin developers.
December 09, 2005
Introducing the Build Server
One of the major new directions for IntelliJ IDEA 6.0 “Demetra” is teamwork support, and the build server is one of the key components for that. The build server is designed to replace tools like CruiseControl, and to provide continuous integration and automated build services for teams.
Sounds boring? So it does to me… I’ll leave the detailed description of the features and competitive advantages of our build server to our marketing guys (and girls), and provide instead the things that are more interesting for developers – project background and pretty pictures. For now, the Demetra roadmap should give you an idea of the features we plan to implement.
As it usually happens at JetBrains, one of our main motivations for starting the build server project was the desire to ease our own pain. As the Demetra development was beginning, we found ourselves with three branches of parallel development (IDEA 5.0.2, IDEA 5.1 and Demetra) and three sets of unit tests that we needed to run on each build. And this does not include the nightly release build that also needs to be run for three branches. With the system we were using previously (a separate machine running CruiseControl for every set of tests), we would have needed nine or ten machines to run the continuous integration and builds. Obviously, this is quite a pain to maintain, and we quickly became interested in a solution that would allow us to distribute all these builds between a smaller number of machines.
The new build server allows to install build agents on any number of available machines, and automatically distributes the builds between the agents. Builds can be triggered by different events, for example, by source control checkins or by timer. If many agents are available, it’s often possible to start running tests for a new set of changes while tests for previous changes are still running, and thus to get faster failure notifications.
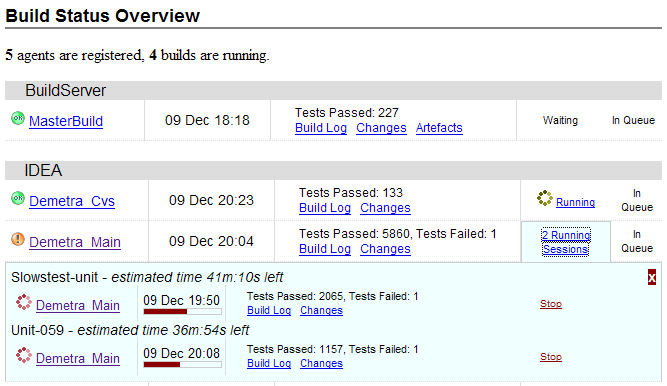
The picture above is a screenshot of the Web interface of our build server. We’re using AJAX extensively to provide a constantly up-to-date view of the build status. The progress bar actually moves to reflect the build progress, and failed tests are immediately displayed on the page.
Another big motivation was the desire to reduce the clutter caused by build notifications. Previously, the CruiseControl build notifications were sent by e-mail to every user on the team. The e-mails quickly filled up mailboxes, and it was quite hard to understand quickly from a failed build e-mail who was responsible for the failure and what exactly was the problem (some new failure or an old problem still not fixed).
The new server allows sending notifications by Jabber messages, and tracks the difference in test status between consecutive builds (which tests started to fail in the last build, and which were and still are failing). The plugin for IntelliJ IDEA also makes it very easy to see the details of the tests failing on the build server, and navigate to the failure locations. (Notice that the test tree is also updated live – on the screenshot below, the last test is still running.)

Of course, the IDEA plugin also provides a summary view of the build status, so that you don’t need to switch to your Web browser to see the current state of the builds.
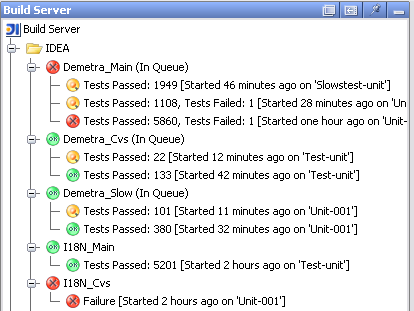
We’ve been using the build server exclusively for our continuous integration for a few weeks now, and the release builds were also recently switched to the build server. Of course, the switch did not require us to rewrite our build scripts – we’re still using the same Ant build files partially generated from the IDEA .ipr file, and we only needed to make a few tweaks to enable running the builds in a distributed environment. But only during the past week enough work was put into the user interface to allow me to write this post, with all the pretty pictures in it.
This is just a brief introduction, and it doesn’t even cover all features already implemented in the build server (like changes browsing, artefact management or build number management). If you’re curious to learn more, stay tuned to this blog. Or better yet – come to JavaPolis next week, and watch the live demo of the build server and other IDEA features given by Max Shafirov and Mike Aizatsky, the project managers of IntelliJ IDEA.
December 06, 2005
IntelliJ IDEA 6.0 "Demetra": JavaScript navigation and completion
Unlike all features I described previously, this one has parts of my work in its implementation. Before we committed to improving the UI designer and I was assigned to that project, I spent some time on foundation work for the new JavaScript support. After I switched to UI designer development, the JavaScript plugin was picked up by Maxim Mossienko, and he greatly improved upon my foundation and implemented many new features on top of it.
The key thing that we added in Demetra is cross-file navigation and resolve. The JavaScript plugin builds an index of all functions and variables in the project, and uses it for resolving references. We spent some time discussing the possibility of implementing a type inference algorithm to make the plugin aware of specific object types that can be contained in each variable, but then we decided that a huge amount of work is required to make this feature really useful, and it will not work in all cases anyway, because of the very dynamic nature of the language. Because of this, the current reference resolution algorithm is based only on method names. Also, we have not yet added any scoping rules – we assume that all JavaScript code is visible from anywhere in the project.
The JavaScript symbol index is currently stored only in memory and rebuilt on every project open. Later we plan to provide the possibility to make this index persistent (possibly reusing our existing Java repository) and correctly updatable. Of course, all these facilities will be available to other custom languages as well.
The first feature based on the new index, and the only one I implemented myself, is “Goto Symbol”:
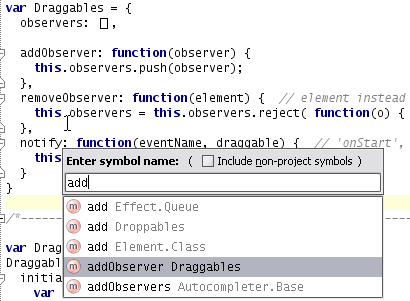
During testing we have found out that different large-scale JavaScript libraries use different styles of assigning functions to object properties, and the plugin should currently be aware of all commonly-used ones.
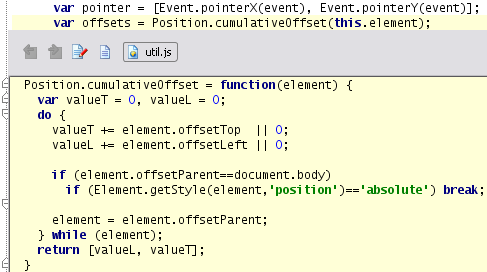
“Goto Definition” for cross-file references was added by Maxim. The “Show Implementations” feature is based on the same underlying mechanism but is easier to show on a screenshot, so I’ll use that to demonstrate the feature.
The new symbol index is also used for completion:

(Speaking of JavaScript, yesterday we started a Companion Products program, and one of the products offered in it is Inspection-JS by Sixth and Red River Software. Inspection-JS is a plugin for IntelliJ IDEA 5.0 which can detect many common programming errors in JavaScript code, and provides quick fixes for a number of the errors. You can learn more about the Companion Products program from a blog post by Alex Tkachman, the Marketing Director of JetBrains.)
December 02, 2005
IntelliJ IDEA 6.0 "Demetra": Structural Search Inspections
Static code analysis (code inspections) has long been a strong point of IntelliJ IDEA, and with the addition of the InspectionGadgets plugin in version 4.5, the capabilities of IDEA have become nearly unmatched in the market. After all, is there any developer who doesn’t enjoy getting many of his bugs found by the development environment, automatically, and often with suggested automatic fixes?
The inspection system of IntelliJ IDEA has always been extensible, however, adding new inspections required writing plugins, and was a rather non-trivial task – until now. In Demetra, we have combined inspections with the Structural Search and Replace feature, which allows to find and modify fragments of Java code by specifying patterns to search for.
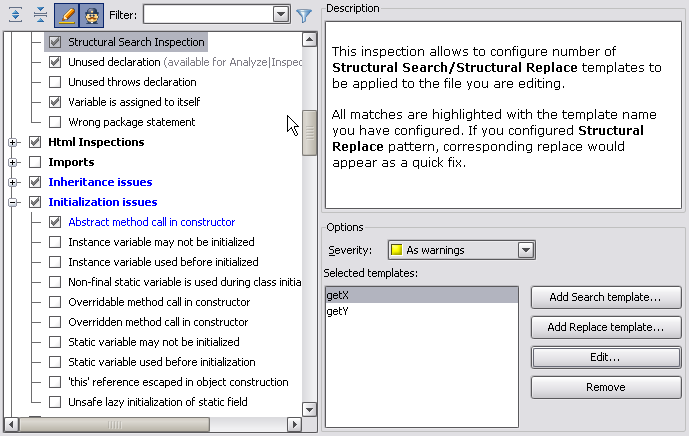
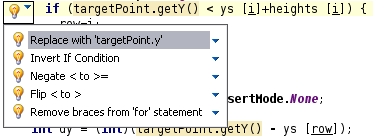
The Structural Search Inspection allows the developer to specify a number of structural search templates which are automatically searched in every file the user is editing, and their occurrences are highlighted. If the developer has specified a replacement template, it is used to build the quickfix for the warning.
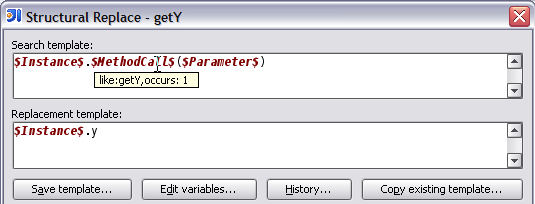
Essentially, this allows every developer to build a collection of “anti-patterns” – code fragments which should never be used in the code – and provide replacements for them.
This feature will become even more powerful with the addition of team-wide sharing of inspection profiles, as the entire team will be able to share the collection of “anti-patterns” and their recommended replacement. However, the profile sharing is a feature that’s currently in early stages of development, so that will be a topic for another blog post…