New in Datalore: Chart Cells, Spelling and Grammar Checking, Initialization Scripts, and More
Greetings from the Datalore team!
Does the #Tesla stock price depend on Elon Musk’s mood? In this newsletter, we’ll share a new tutorial for sentiment analysis and talk about the new features that can improve your daily workflow in Datalore.
Chart cells
Could you imagine that working with visualizations in Python would be as easy as it is in spreadsheets? Last month we took a step further towards this idea and released a new type of cell – Chart cells.
Chart cells allow you to create visualizations for any data frames you already have in your notebook with just a few clicks.

With Chart cells you can:
- Create layered plots for one or multiple data frames on one canvas.
- Produce point, line, bar, area, correlation, and regression plots.
- Specify the width, height, titles, and axis labels for the plot.
- Get visualizations for a full dataset or on an auto-sampled one.
- Configure the axis scale and choose between reverse, continuous, discrete, sqrt, and log10 options.
Furthermore, you can collaborate with your team on these chart cells and see the same visualization state.
How is the Chart cell different from the Visualize tab?
The Visualize tab computes plots on the client side, whereas Chart cell outputs are computed on the server. This way, the Visualize tab is designed for quick exploratory data analysis on sampled datasets and Chart cells are made for collaborative visualization and complex multilayered plots over datasets of any size.
We plan to add a direct transition between Visualize tab and Chart cells, so stay tuned!
Please reach out to us if you have any feedback on this feature by clicking “Give feedback” near the Account settings.

Spelling and grammar-checking for Markdown cells
Whether you are working on a scientific article or are preparing a report for your colleagues, you will likely need to describe your thoughts with Markdown text. Jupyter notebooks lack this feature by default, and there is a lot of space for typos and accidental grammar mistakes that can spoil your work.

Recently we’ve integrated a spell-checking feature into Datalore notebooks that highlights your mistakes and gives context aware suggestions.
Behind the scenes, there is a ML algorithm provided by the Grazie platform, developed at JetBrains. The Grazie team is constantly developing their platform and you can expect quality updates every week!
Initialization scripts
When it comes to setting up the environment, things aren’t always straightforward. For Python packages we integrated the Package manager that takes care of dependencies, offers several pre-configured base environments, and makes persistent changes. However for some projects you might also need C++ tools and additional utilities on a daily basis.
Before, it was possible to install additional tools manually using Terminal or magic commands in cells. Last month, we added the possibility to specify all the tools you need in one initialization script.
In the Environment tab, you can now find the init.sh file that you can edit right inside Datalore.
The script will be run every time on computation start before the package manager installs additional dependencies.
To apply the init.sh script to any notebook inside your workspace, you can move the init.sh file to workspace files and it will be executed on each notebook start.
Tutorial on sentiment analysis
When @elonmusk tweets, the world listens. Have you heard the story of how Elon Musk raised the stock price of Dogecoin? Do you know what his most active day on Twitter was? Which emojis he uses most frequently?
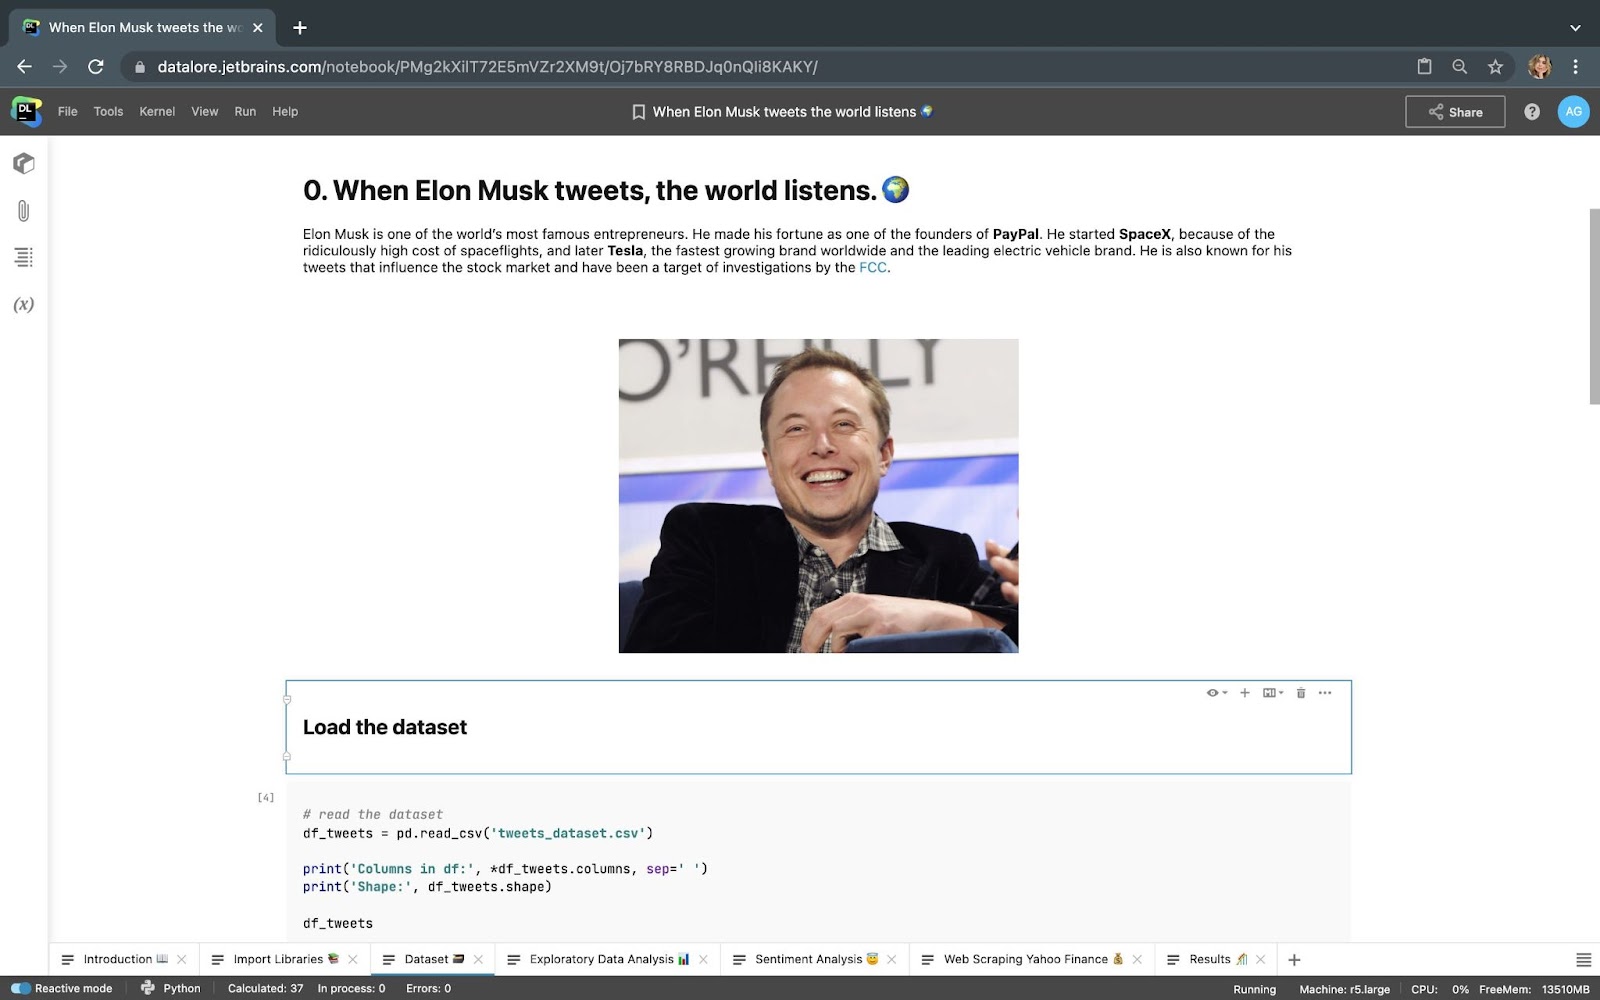
Last month we explored the tweets of Elon Musk, performed a sentiment analysis, and looked at whether changes in the tweet sentiment influences stock price changes.
The notebook is meant to be fun and educational. It won’t put millions in your pocket, but rather a smile on your face 🚀
Other updates
- If you’ve missed the announcement about the new Reactive mode, check it out here.
- Now workspace editors can publish notebooks from shared workspaces and they will appear in the Published notebooks section of the workspace family system.
That’s all for now. Follow us on Twitter @JBDatalore to hear about our updates!
Happy data sciencing!
The Datalore team
Subscribe to Datalore News and Updates


