Datalore
Collaborative data science platform for teams
How to Prepare Your Dataset for Machine Learning and Analysis

The bedrock of all machine learning models and data analyses is the right dataset. After all, as the well known adage goes: “Garbage in, garbage out”! However, how do you prepare datasets for machine learning and analysis? How can you trust that your data will lead to robust conclusions and accurate predictions?
The first consideration when preparing data is the kind of problem you’re trying to solve. Maybe you want to be able to recognize someone’s emotional state from their facial expressions? In this case, your dataset will probably need to contain images or videos of people’s faces. Or perhaps you’d like to build a model that identifies spam emails, so you’ll need to get your hands on some email text data.
In addition, what data you need also depends on the kind of algorithm you want to use. Supervised learning algorithms, such as linear regression or decision trees, require a field containing the true value of an outcome for the model to learn from, called a target, as well as fields that contain information about the observations, called features. In contrast, unsupervised learning algorithms, such as k-means clustering or collaborative filtering-based recommendation systems, will generally only need features.
Finding the data is only half of the work, however. Real-world datasets can contain all sorts of pitfalls which can render all of your hard work useless if you don’t screen for and fix them prior to getting started. In this blog post, we’ll discuss some of the major pitfalls that datasets for machine learning and analysis can throw at you, and some ways in which Datalore can help you to quickly spot and remedy them.
Is your data measuring what you think it’s measuring?
Most datasets for machine learning projects or analyses are not purpose-built, meaning that occasionally we have to guess how the fields were collected or what they actually measure. In the absence of a data dictionary, or someone to explain what the dataset’s fields mean, we may need to work this out based on the information we have.
One way that we can determine what our features are measuring is by checking their relationships with other features. If two fields are supposed to be measuring similar things, then we would expect them to be highly related. Conversely, if two fields are measuring very different things, we would expect them to be unrelated. These ideas are known as convergent and discriminant validity respectively.
Another important thing to check is whether any of the features are too highly related to the target, which may indicate that this feature is getting access to the same information as the target. This is known as feature leakage, and using these features can artificially inflate how well your model will perform.
Datalore allows you to quickly scan for the relationship between continuous variables using the Correlation plot in the Visualize tab for a DataFrame. Other ways of checking these relationships are using bar plots or cross tabs, or effect size measures such as the coefficient of determination or Cramér’s V.
Is your dataset clean?
Datasets can contain all sorts of messiness which can adversely affect our models or analyses. Some of the most important indicators of dirty data are:
- Implausible values: This includes values that are out-of-range, such as negative values in a count variable, or frequencies that are much higher or lower than expected for a particular field.
- Outliers: These are extreme values, which can represent anything from encoding errors that occurred at the time when your data was being written, to rare but real values that sit outside of the bulk of your other observations.
- Missing values: The pattern and amount of missing data determines the impact it will have, with missingness that is related to your target or features being the most serious.
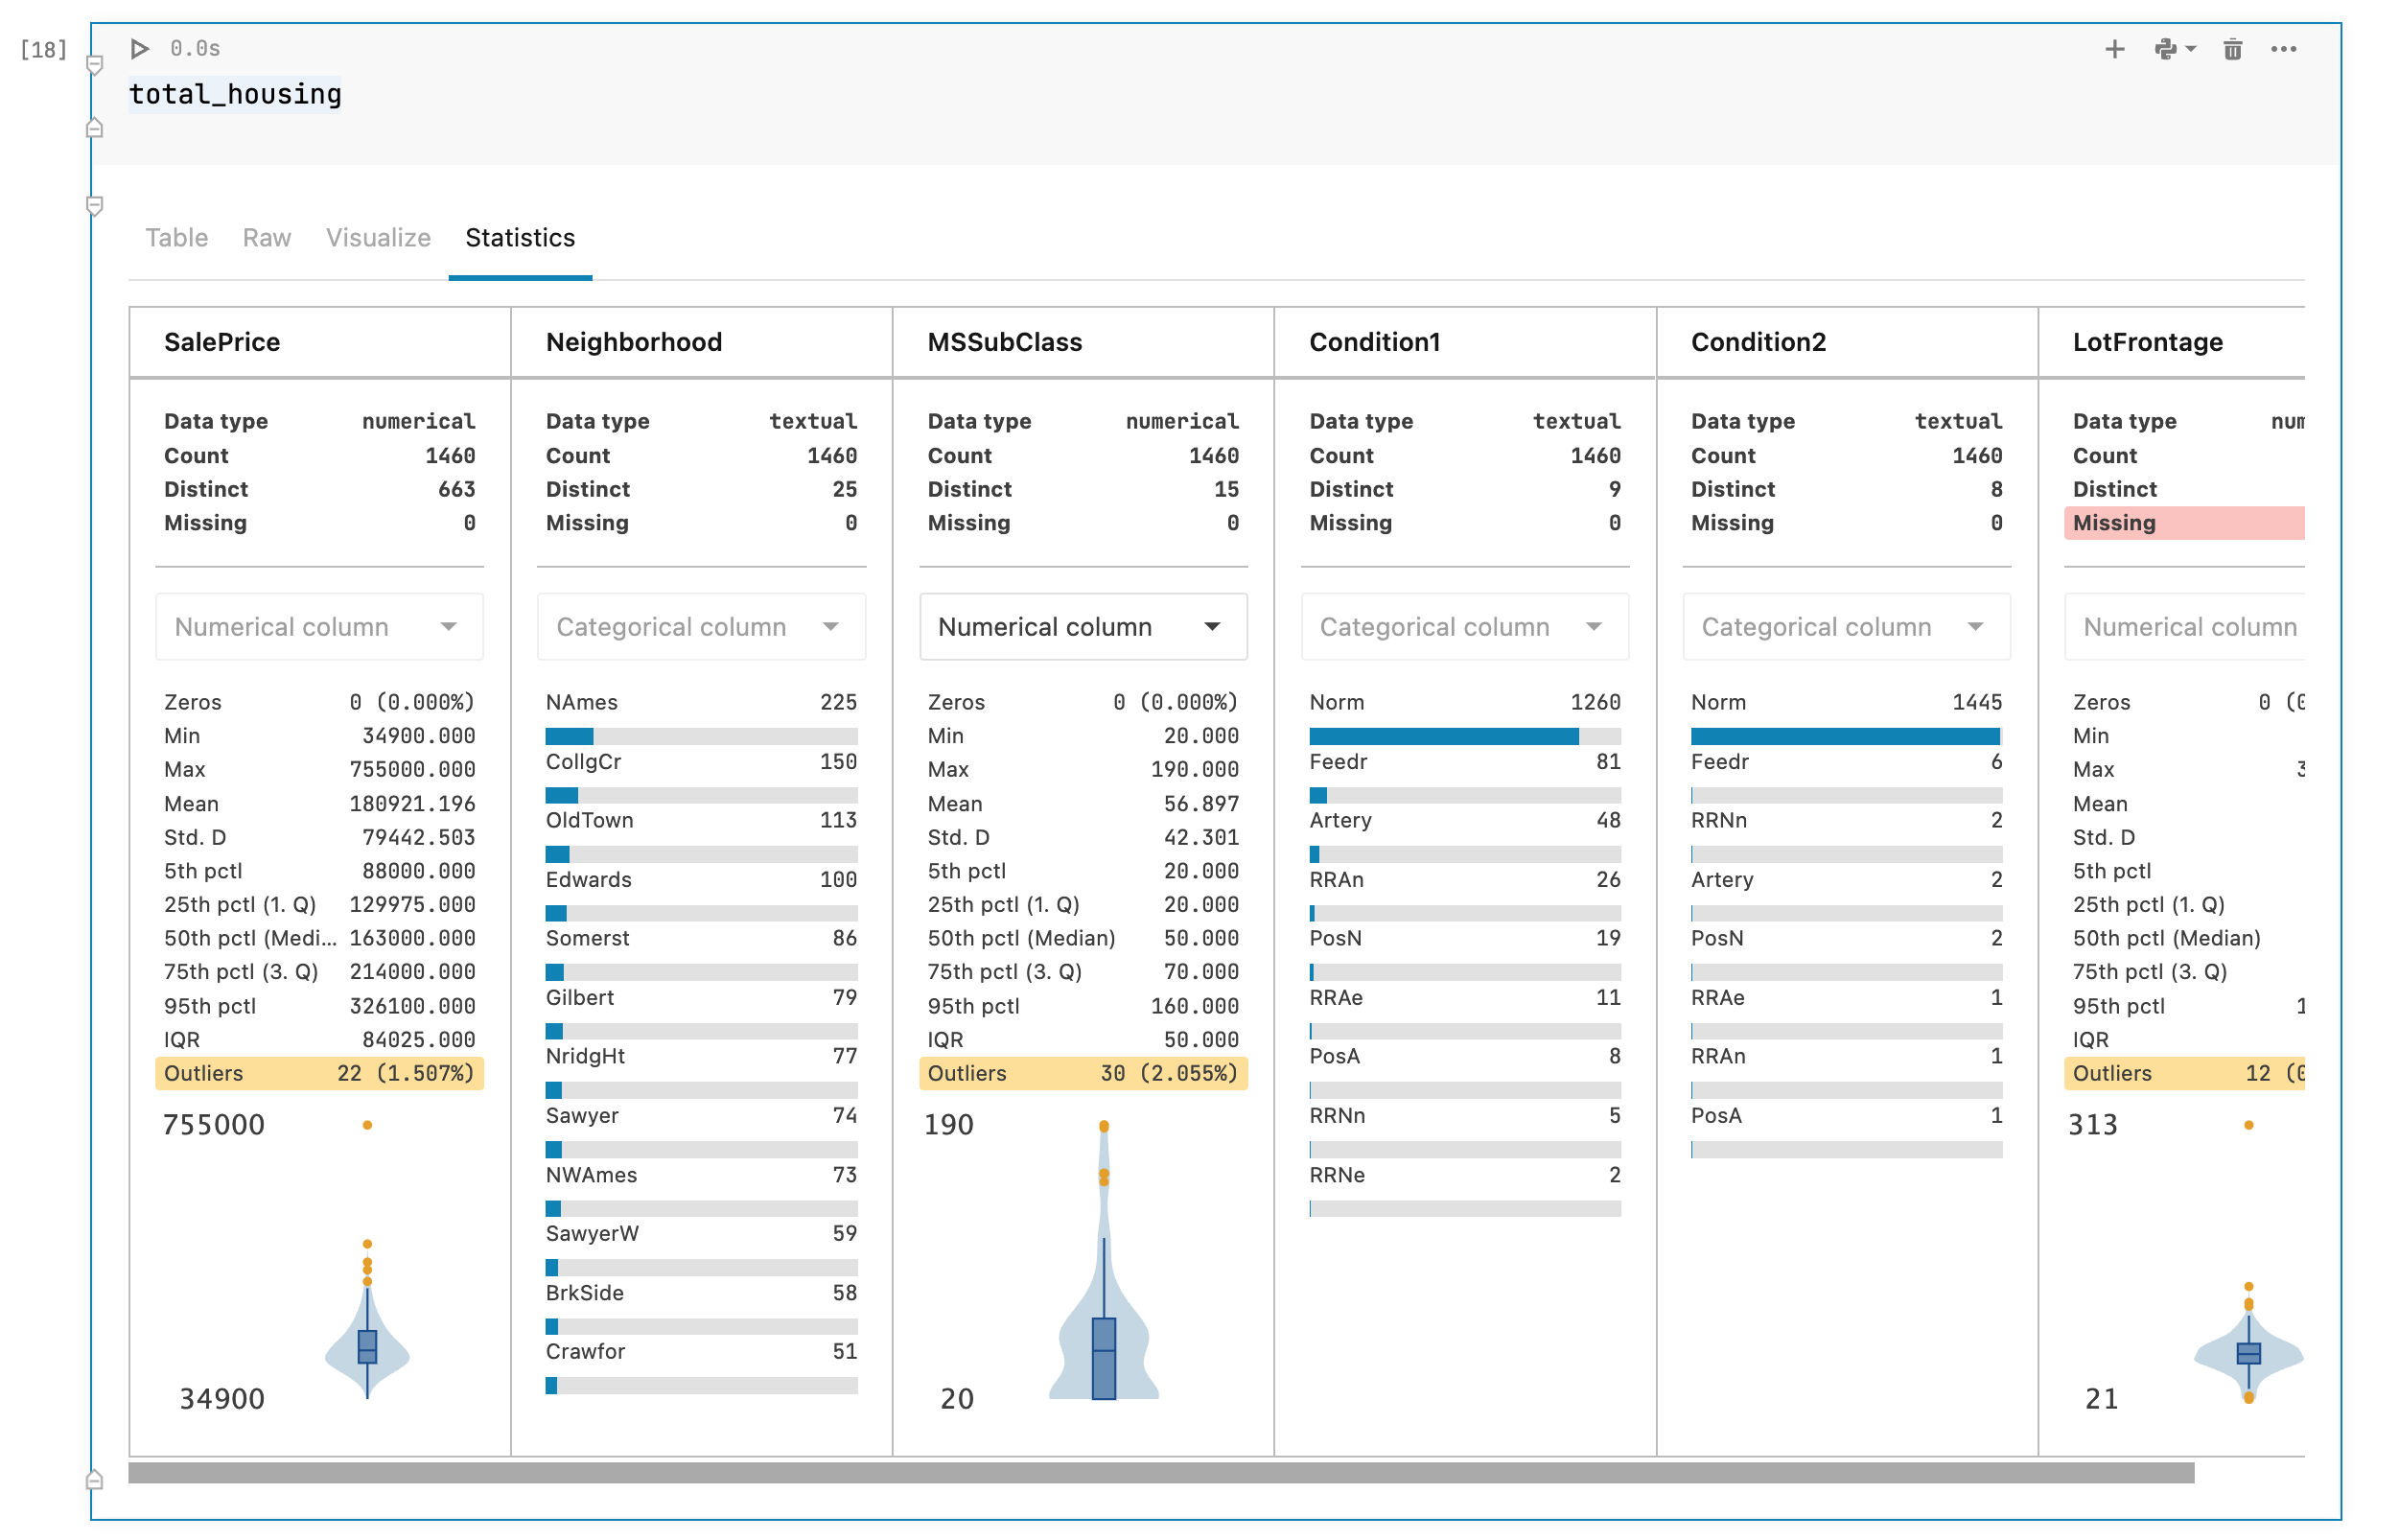
Dirty data can reduce the quality of your analyses and models, largely through reducing the generalizability of your findings, or leading to poor model performance. Datalore’s Statistics tab allows you to easily check for such issues because it shows the distribution, number of missing values, and the presence of outliers for each field at a glance. Datalore also makes it easy to explore your raw data, allowing you to do basic filtering, sorting, and column selection directly on a DataFrame, with the corresponding Python code for each action being exported to a new cell.
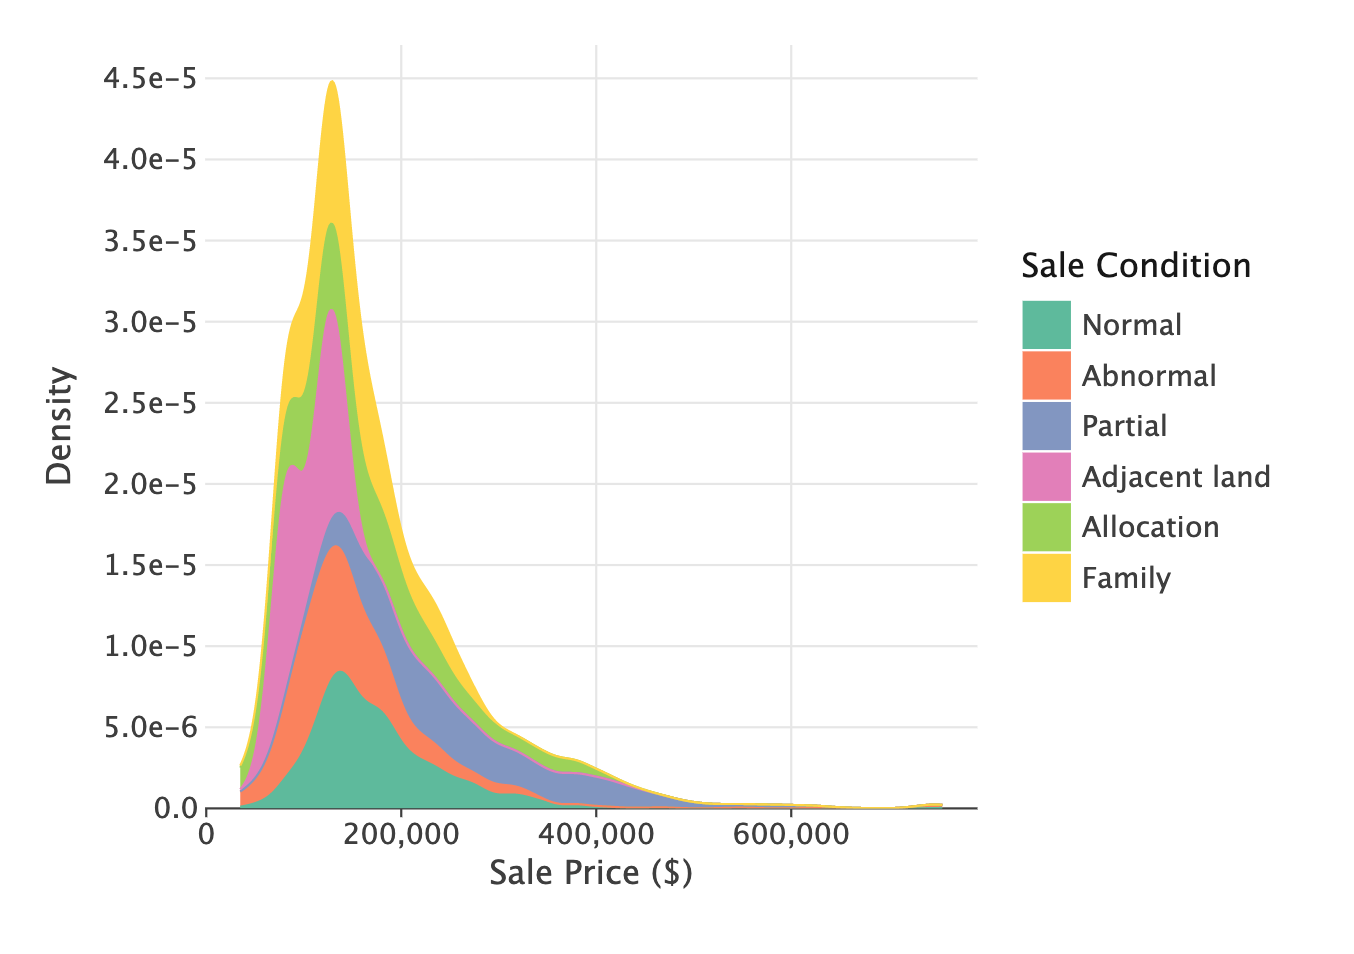
Are your variables balanced?
Imbalanced data occurs when categorical fields have an uneven distribution of observations across all of the classes, and can cause major issues for models and analyses. When you have a very imbalanced target, it can create lazy models which can still achieve good performance just by defaulting to predicting the majority class. Let’s take an extreme example, where we have a dataset where 90% of the observations fall into one of the target classes and 10% into the other. If we always predicted the majority class for this dataset, we’d still get 90% accuracy, showing how in such cases, a model that learns nothing from the features can still have excellent performance!
Features are also affected by class imbalance. Models work by learning patterns, and when classes are too small, it’s hard for models to make predictions for these groups. These effects can compound when you have several imbalanced features, leading to situations where a particular combination of rare classes might only occur in a handful of observations.
Imbalanced data can be rectified through various sampling techniques. Undersampling is where you reduce the number of observations in the larger classes to even out the distribution of data, and oversampling is where you create more data in the smaller classes. There are many ways of doing this. Some examples include using Python packages such as imbalanced-learn or services such as Gretel. Imbalanced features can be also fixed using feature engineering that aims to combine classes within a field without losing information.
Is your dataset representative?
When you are creating a dataset, you’ll have a target group in mind that you want your analysis or model to work for. For example, you might want to make a model to predict how likely it is that American men interested in fashion will buy a certain brand. This target group is your population that you want to be able to make generalizations about. However, as it’s not usually practical to collect information about every individual in this population, so instead we use a subset called a sample.
Sometimes issues occur which mean that your sample data for machine learning and analysis doesn’t properly represent your population’s behavior. These are called data biases, and can mean that any analyses or models based on your sample won’t generalize to your population. For example, you might not capture all of the population’s subgroups in your sample, a type of bias called selection bias.
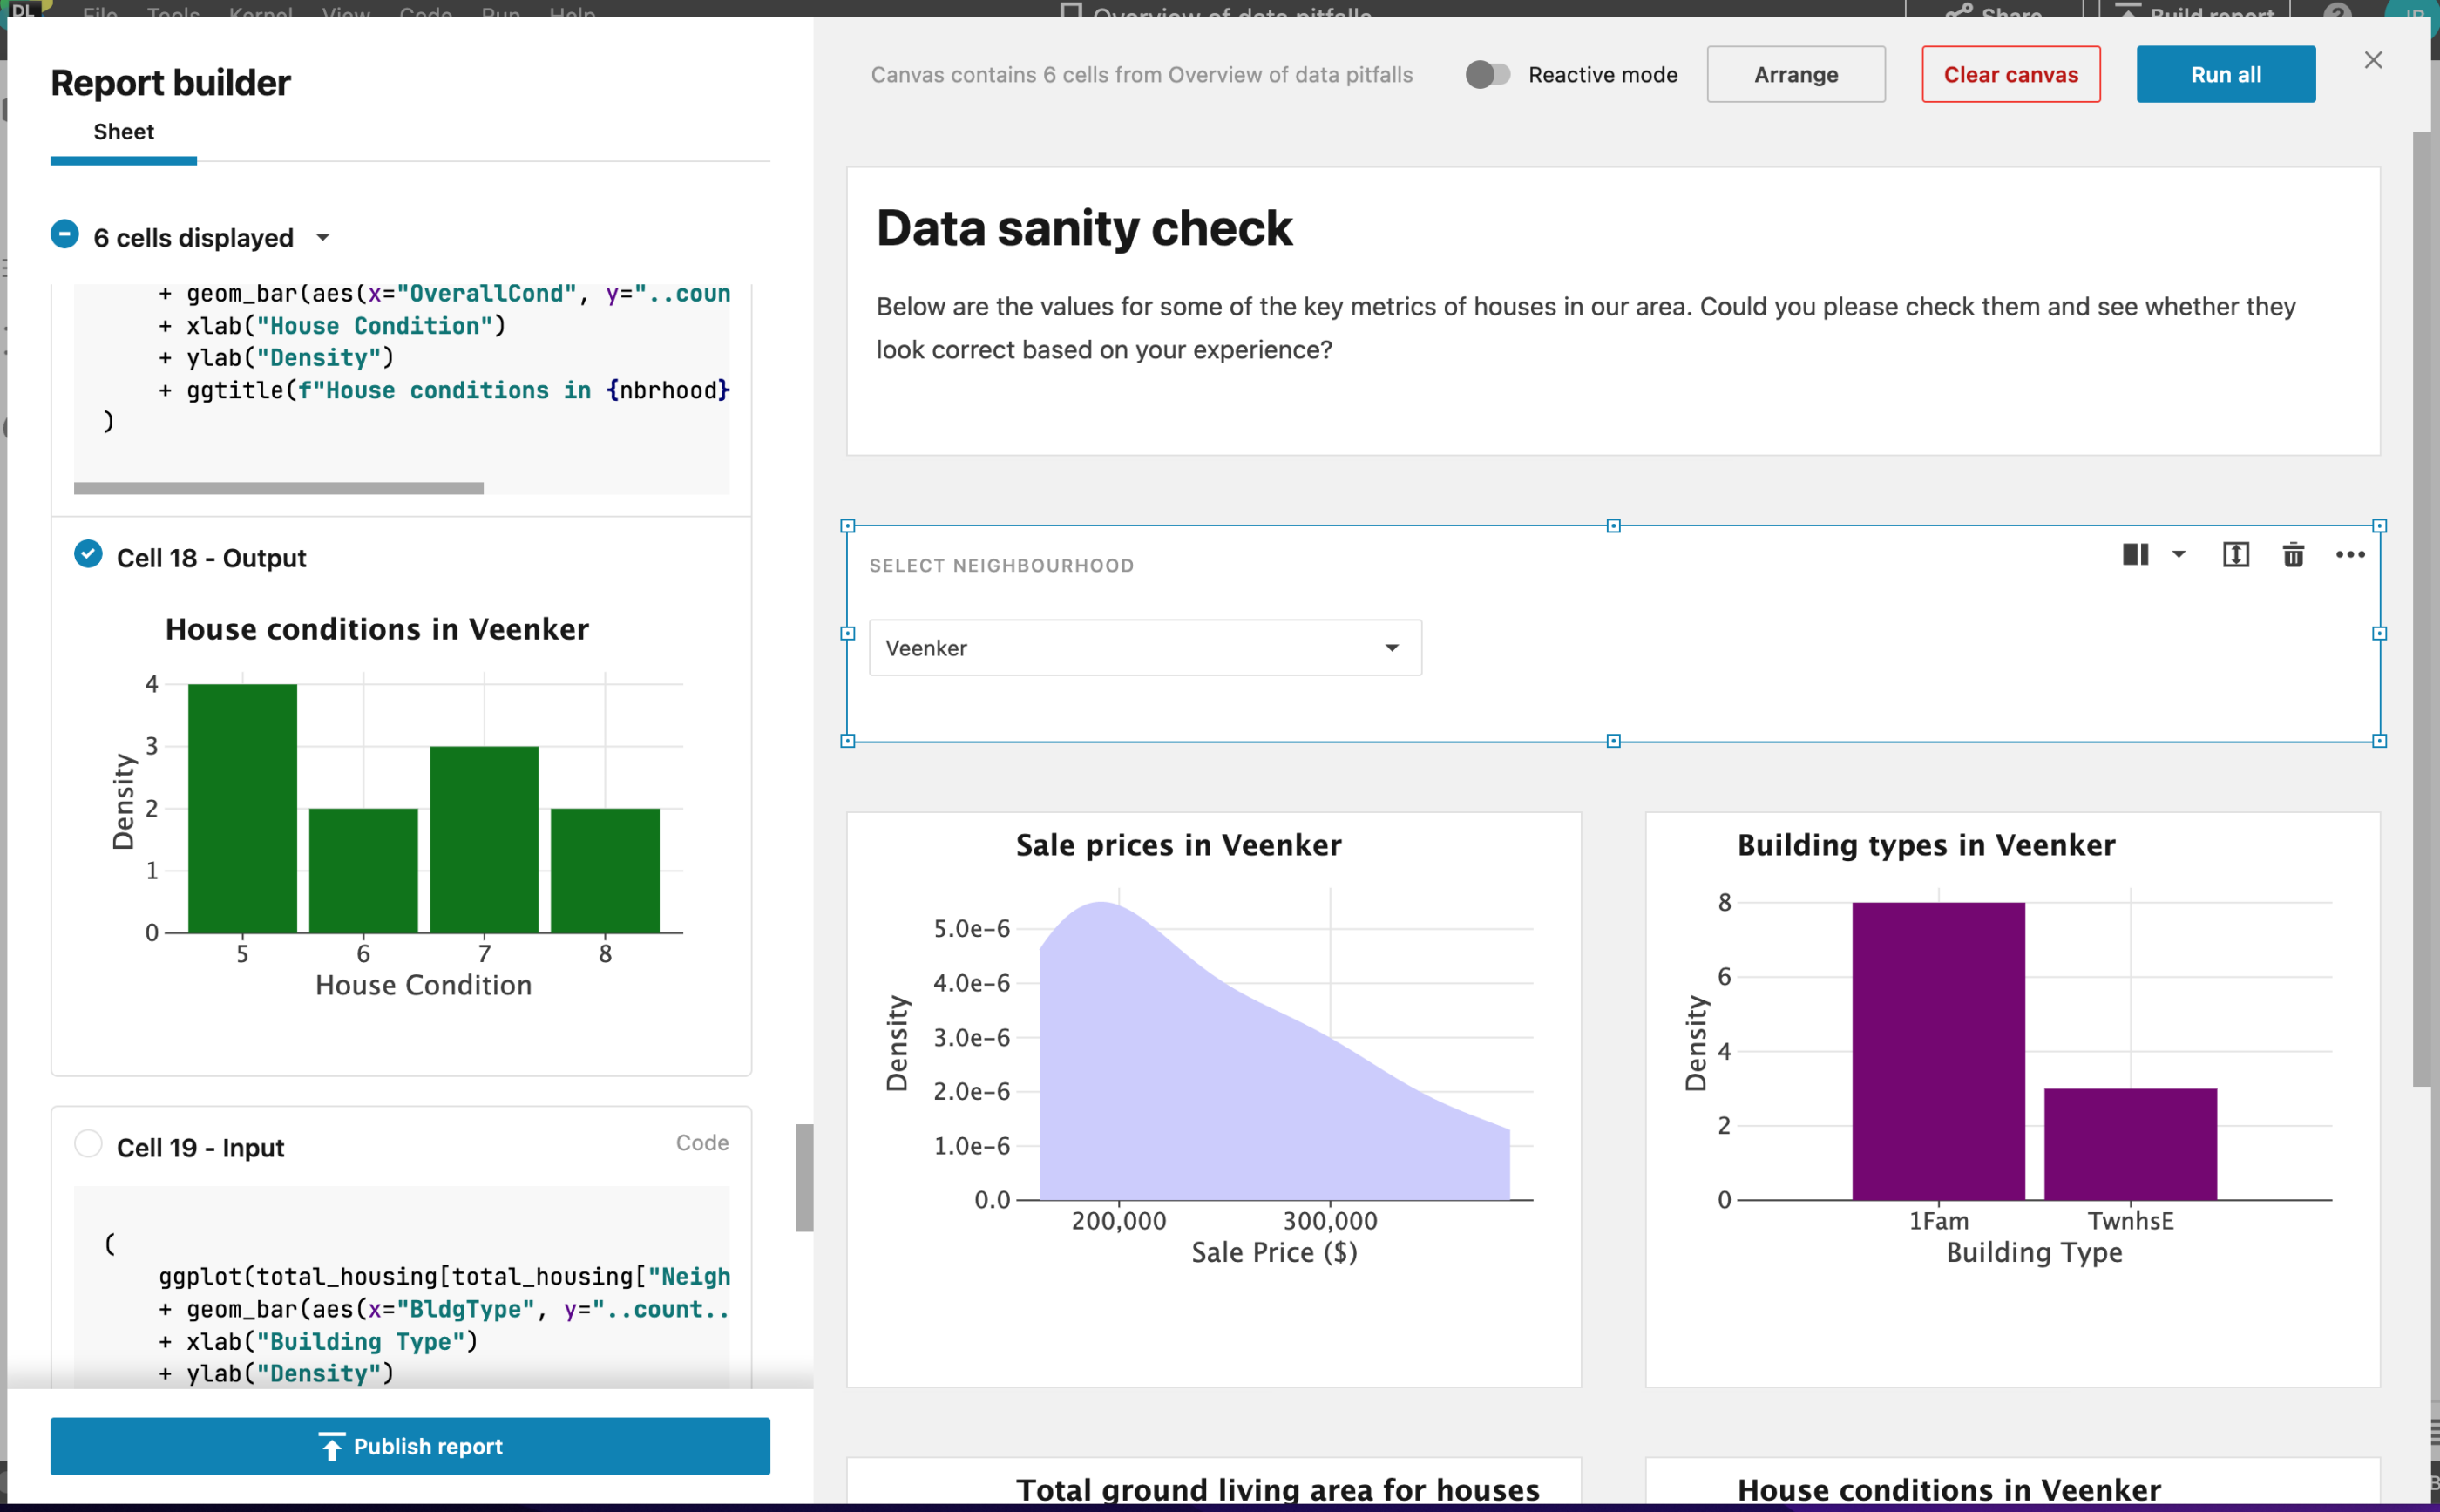
A way to check for bias is to inspect the distribution of your data’s fields and check that they make sense based on what you know about the population. Using Datalore’s Statistics tab makes this straightforward, allowing you to scan the distribution of both continuous and categorical variables for a DataFrame. You can also use Datalore’s Report Builder to share your results with domain experts who might be able to recognize any issues.
Are you measuring your models’ true performance?
One final issue that can trip you up is measuring the performance of your models. Many models are prone to an issue called overfitting, which is where the model fits so well to the training data that it doesn’t generalize well to new data. The telltale sign of overfitting is a model that performs extremely well on the training data, and significantly less well on new data. The way to account for this is to split your dataset into multiple sets: a training set for training the model, a validation set for comparing the performance of different models, and a final test set to check how the model will perform in the real world.
However, creating a clean train-validation-test split can be tricky. One important issue is data leakage, where information from the other two datasets leaks into the training set. This can result in problems ranging from the obvious ones, like duplicate observations ending up in all three datasets, to more subtle issues like using information from the whole dataset to do feature preprocessing prior to splitting the data. Additionally, it is important that all three datasets have the same distribution of targets and features, so that each is a representative sample of the population.
In order to avoid any issues, you should split your dataset into train, validation, and test sets at the very beginning of your work, prior to doing any exploration or processing. In order to ensure that each dataset has the same distribution of each field, you should use a method like train_test_split from scikit-learn which is specifically designed to create representative splits of your data. Finally, you should compare the descriptive statistics of each dataset to check for signs of data leakage or uneven splits, which is easily done using Datalore’s Statistics tab.
I hope this has given you an overview of some of the most important issues that can occur when preparing data for machine learning and analytics, and how to mitigate them. While this can be a time-consuming part of your work, using the right tools can make it quicker and easier to spot issues early, giving you a solid foundation to create insightful analyses and high-performing models.
Subscribe to Datalore News and Updates