.NET Tools
Essential productivity kit for .NET and game developers
How-To's


How to find which objects take up the most memory?
Memory profiling is the newest thing about dotTrace Profiler 2.0 (currently released as a beta). You are invited to explore this useful feature by reading our simple answer to one simple question: Which objects allocated by my application take up the most memory?
Here’s how you can find out:
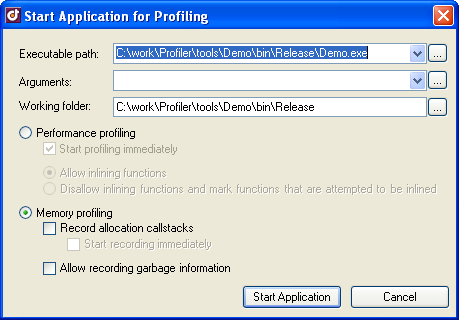
- Open dotTrace and on the Welcome screen click Profile Application (or Windows Service or Web Application as appropriate).
- Specify the path to your application, the Windows service you want to profile, or the starting URL of your web application. Select Memory profiling and click Start application.
- The application started, and the following dialog window is displayed:
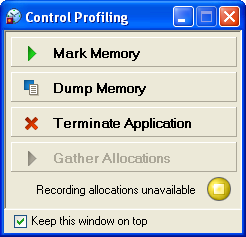
Now, have your application exhibit the behavior you want to profile: perform some calculations, open some files, or what have you. Then, at the moment when the application is using the most memory, click Dump Memory in the dialog above to get the current snapshot of the application’s memory. - The memory snapshot (click the thumbnail below) is generated and opened for your review. You can see the default tab – Roots – and the default view – Class List. This should be enough to get the first idea of what is going on with objects currently allocated in memory.
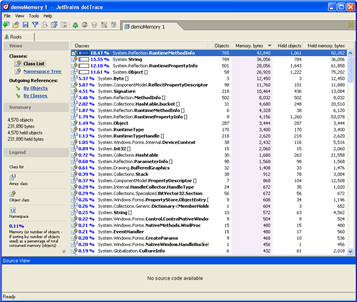
- The list is sorted by the Memory column. The classes of objects that take up the most memory appear at the top of the list. In addition, the rightmost column, Held Memory, displays the amount of memory each class of objects holds, that is, all the memory consumed by objects which are referenced exclusively by a given class. For example, if you were to delete all objects of
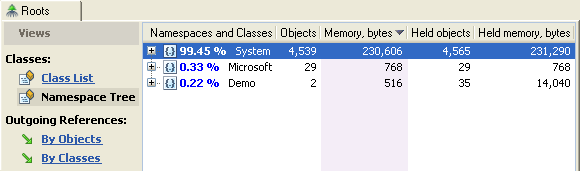
System.Reflection.RuntimePropertyInfo[](highlighted on the full screenshot), you would free up not only the 4,156 bytes (1.79% of all memory) they consume by themselves, but also the 53,078 held bytes (~23%) of all memory. - Also, you can see the namespaces whose classes consume the most memory. Just switch to Namespace Tree view. The classes and objects are grouped by namespace, each of which you can browse and analyze.

It’s your application, so you decide what matters more. dotTrace gives you the tools to do it.
Prev post JetBrains dotTrace 2.0 Beta ReleasedHow to focus on a subsystem in a dotTrace snapshot? Next post
Subscribe to a monthly digest curated from the .NET Tools blog: