

.NET Tools
Essential productivity kit for .NET and game developers
Profiling ASP.NET vNext using dotMemory and dotTrace

With ASP.NET vNext (working title), Microsoft is making some bold moves towards opening up development and deployment options for building applications. For starters, we no longer have to install the full .NET framework on our servers: ASP.NET vNext lets us deploy our own version of .NET on an app-by-app basis. Next, the project model is being migrated to being just a project.json file describing dependencies and some optional configuration, much like we write apps in NodeJS.
ASP.NET vNext is still in an early preview, but it never hurts to explore and test-drive what’s going to be the next generation of .NET. And when writing code for it, we may want to inspect performance and memory of our applications to verify we don’t have any issues there. And what better tools than dotMemory and dotTrace to do that?
Setting the correct CLR type
Before we start profiling, it is important to know that profiling currently only works when the Desktop CLR is active. The new Core CLR does not (yet?) expose the same profiler hooks.
Checking if the correct CLR is active can be done from the command line using the kvm list command.
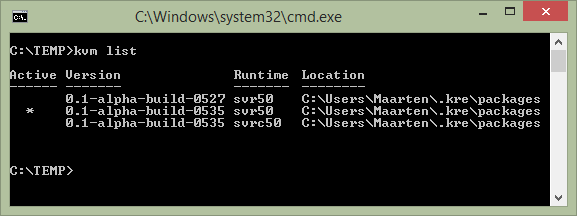
Make sure that the active CLR (marked with an *) shows the svr50 runtime. If it’s svrc50 that means we’re on the Core CLR and have to switch to the Desktop CLR using the kvm set <pick the correct version from the above list> command.
Attaching to an already running ASP.NET vNext process
After starting dotMemory or dotTrace, hit Attach To Process on the toolbar. This will give us a list of all running processes on our local computer. Both profilers can also attach to processes running on remote machines. From this list, find the klr.exe process. When running multiple ASP.NET vNext applications on our machine, it will be a bit tricky to find the correct one.
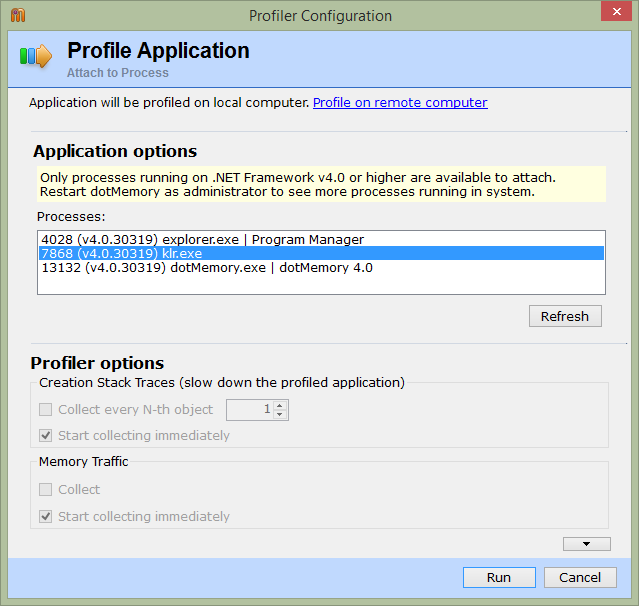
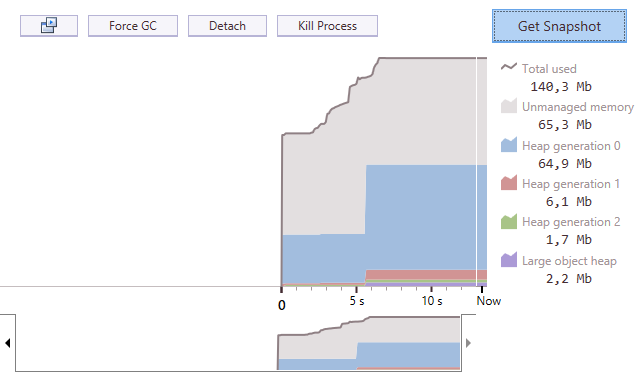
We can provide additional options and even make use of the profiler API in our ASP.NET vNext applications. Hitting Run will attach the profiler which will behave identical to profiling “classic” .NET applications. For example in dotMemory, we can see the memory usage (unmanaged and managed heaps) in real-time:
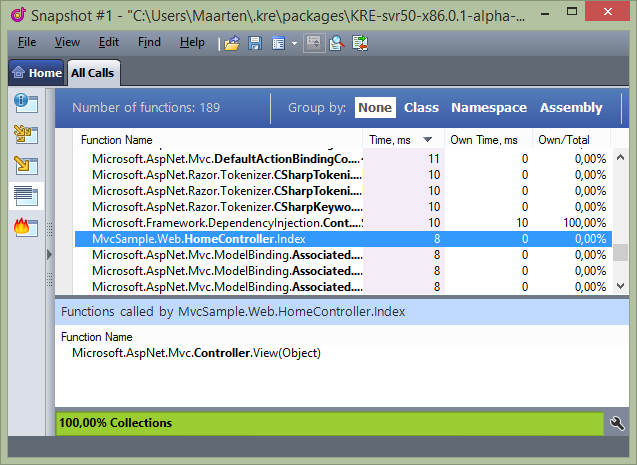
In dotTrace we can see the subsystems used by our code and drill down to the function or thread level.
Starting an ASP.NET vNext process with profiling enabled
When attaching to an already running process, some options will be unavailable. For example, dotMemory will be unable to collect memory traffic for an already running application. It will be impossible to pick a more detailed profiling mode for dotTrace, such as Tracing or Line-by-Line profiling. For these options to be available, we have to launch the process with profiling enabled from the start.
Running ASP.NET vNext applications is done using the k run or k web commands. These are aliases for the active runtime which is located under %USERPROFILE%\.kre\packages\<seleced runtime>\. From dotMemory and dotTrace, we can use the Profile | Standalone Application menu and enter the startup details for our ASP,NET vNext application.
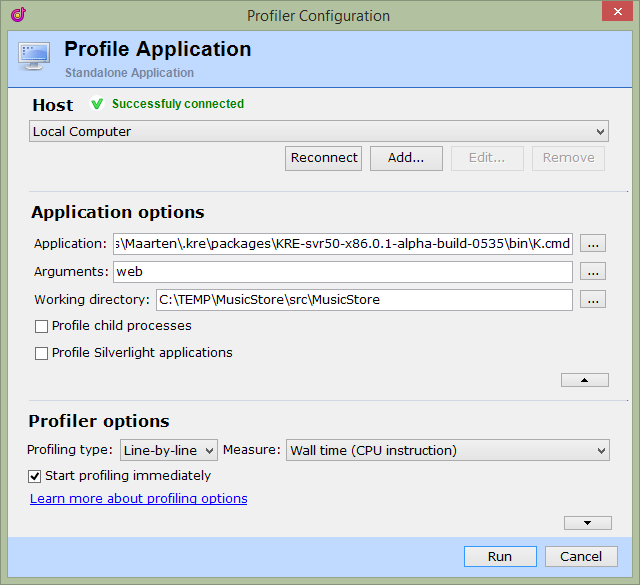
Here’s what we have to specify:
- Application: the ASP.NET vNext runtime to use. This will depend on which runtimes we have installed on or system but will look like %USERPROFILE%\.kre\packages\<seleced runtime>\bin\K.cmd.
- Arguments: the arguments we would typically pass to the k command. If we start our application with k web, then web would be the argument to specify here.
- Working directory is the path where our application and its project.json file are located.
Using this approach, we can now set all additional profiler options. dotMemory allows collecting memory traffic while dotTrace will let us perform Line-by-Line profiling and specify the measure used. Run will launch the application and lets us capture a snapshot we can investigate later.
Give it a try! Even with a new CLR in town we still have to care about memory and performance of our applications. Here are some resources to get started with dotMemory and dotTrace:
- ASP.NET vNext information and tutorials at www.asp.net/vnext
- Download dotMemory and explore the tutorials
- Download dotTrace and checkout the tutorials


