

.NET Tools
Essential productivity kit for .NET and game developers
Understanding how SQL queries impact app performance, with dotTrace 6.1

Application performance depends on a huge variety of factors: code design, web server performance, possible network lags, and so on. Effective execution of SQL queries is an additional concern. Naturally, you want your profiler to cover as many of these performance aspects as possible.
In dotTrace 6.1 we introduced the long-awaited ‘SQL queries profiling’ feature. Now you can get exact data on how long a particular query took to execute, as well as what method ran the query.
Important notes:
-
SQL queries can be profiled only in the Timeline profiling mode.
-
The feature is available not only when profiling standalone applications, but also when you attach dotTrace to an already running process.
-
The following data providers are supported: SQLClient, OLE DB, Entity Framework, and ODBC.
-
As dotTrace uses ETW for collecting SQL events, profiling overhead is minimal. SQL query time is measured very accurately.
Now, let’s take a look at how it works.
How This Works
The only change you’ll notice in the UI is the new SQL Client filter in Interval Filters. Your workflow in Timeline Viewer is still straightforward: after profiling your app, you can start by looking at the Interval Filters.
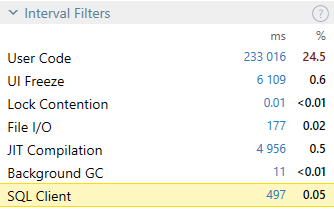
In our example, the app works with SQL for 497 ms. Let’s investigate how.
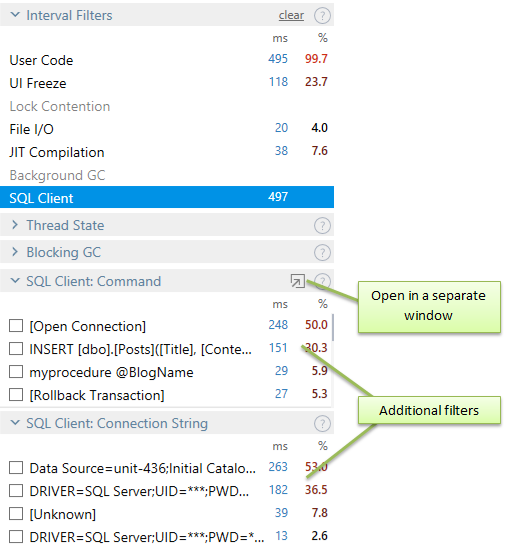
Once the SQL Client filter is on, two more sub-filters appear: SQL Client: Connection String and SQL Client: Command. The first one is helpful in case your app uses several SQL connections. The second one shows how SQL Client time is distributed among particular SQL queries. In other words, it shows how long a particular query took to execute.
As query contents may be long, investigating them in the small Filters window could be problematic. That’s why we added a separate SQL Queries window which formats queries for a more convenient view:
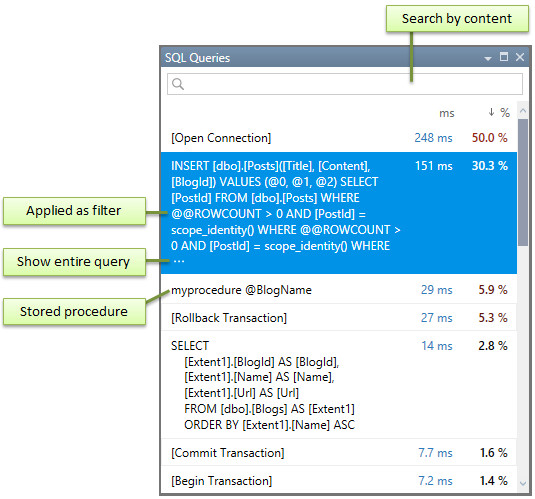
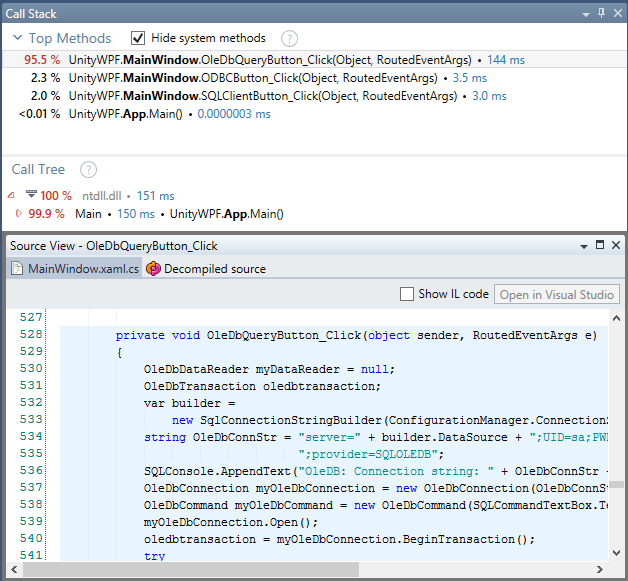
After you find a problematic query, the next step is to determine its origin, i.e. the method that called it. The SQL Queries window (like all other windows in Timeline Viewer) can work as a filter. Double-click a particular query, and all other filters (including Call Stack) will show data only for the time interval when this query executed:
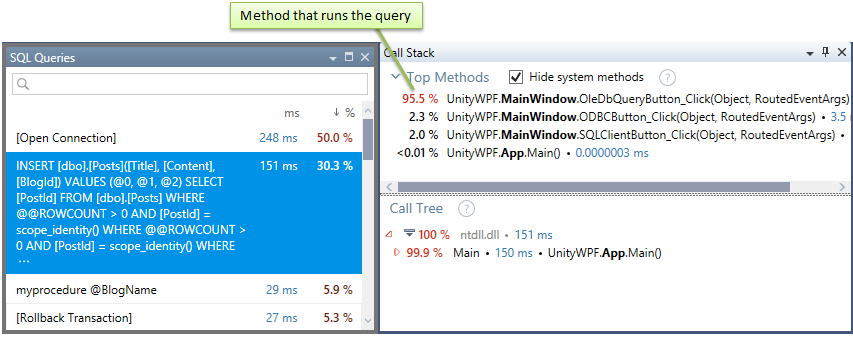
Top Methods will show us the method that is responsible for running the query. Once you select the method in Top Methods, the Source View will show its code:
Thanks for reading! We hope you’ll find this new feature useful. Do try it on your own by downloading the latest dotTrace 6.1.


