Improved JavaScript Debugger in WebStorm 7

The new WebStorm 7 comes with a redesigned debugger for Google Chrome which supports the latest features of WebKit Remote Debugging Protocol and V8 Debugger Protocol.
Though this change mainly affects the debugger’s backend, WebStorm 7 users will definitely notice improvements in its performance, as well as some very useful updates. You can quickly learn about these in the screencast or read this post for more details.
http://www.youtube.com/watch?v=HwH0p9WHXgM
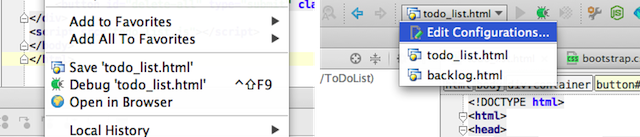
Before jumping into the updates, let’s go over some basics. To start JavaScript Debug Session for any HTML file:
- In the file context menu, click Debug file. The Run/Debug Configuration will be created automatically and the file will be opened in the browser.
- OR
- In the main toolbar, select any configuration that you’ve already used or create a new one, and then click Debug.
Updates and improvements in WebStorm 7
Live Edit
Live Edit allows you to see all the changes that you make in your HTML or CSS files instantly in the browser, without reloading the page (check out our demo). Currently it is available in Google Chrome only, via installing the Google Chrome Extension JetBrains IDE Support.
In WebStorm 7 we have significantly redesigned the Live Edit workflow making it more coherent and predictable. Now it is available in JavaScript Debug Session only. You can enjoy Live Edit for any HTML file and even if you are running a Node.js app.
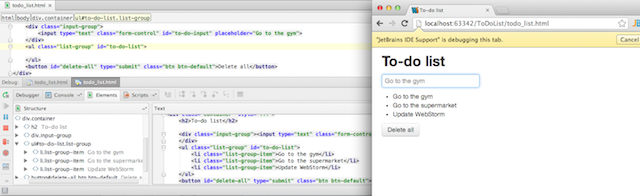
Elements tab
A new Elements tab was added to the debugger. It shows the live HTML content of the page that is being updated. You’ll be able to inspect DOM and see new DOM elements added to the page with JavaScript.
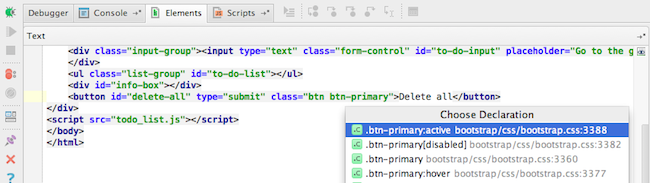
From the Elements tab you can easily navigate to the source files and to the declaration, by pressing Ctrl (Cmd for Mac) and clicking a file name or classe.
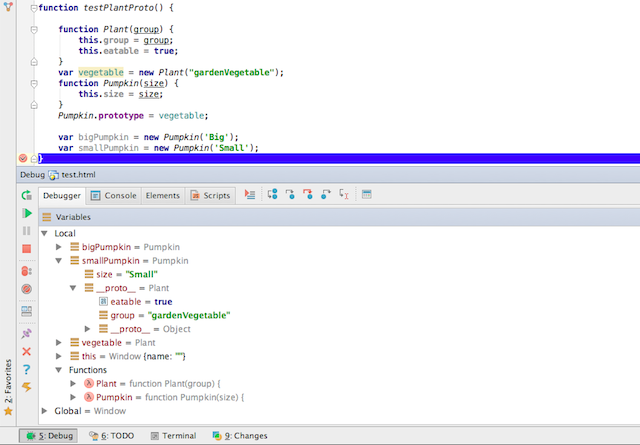
Variables view
Variables have a new improved presentation in the debug window.
The first nice update is that values are now displayed in the same format as in the editor that makes them easier to read. Arrays now have a folded presentation to give you quick access to the element you need.
Second, variables are now grouped into local, closure and global scopes and are separately grouped by functions.
Another important update in Variables view is that now you can see the __proto__ object and inspect its properties.
Try the improved debugger right now in WebStorm 7 Release Candidate.
Develop with pleasure!
Subscribe to WebStorm Blog updates