

.NET Tools
Essential productivity kit for .NET and game developers
Unusual Ways of Boosting Up App Performance. Lambdas and LINQs

This is the third post in the series. The previous ones can be found here:
- Unusual Ways of Boosting Up App Performance. Boxing and Collections
- Unusual Ways of Boosting Up App Performance. Strings
Today, we’re going to uncover the common pitfalls of using lambda expressions and LINQ queries, and explain how you can evade them on a daily basis.
Lambda Expressions
Lambda expressions are a very powerful .NET feature that can significantly simplify your code in particular cases. Unfortunately, convenience has its price. Wrong usage of lambdas can significantly impact app performance. Let’s look at what exactly can go wrong.
The trick is in how lambdas work. To implement a lambda (which is a sort of a local function), the compiler has to create a delegate. Obviously, each time a lambda is called, a delegate is created as well. This means that if the lambda stays on a hot path (is called frequently), it will generate huge memory traffic.
Is there anything we can do? Fortunately, .NET developers have already thought about this and implemented a caching mechanism for delegates. For better understanding, consider the example below:
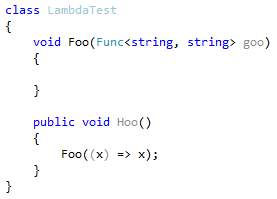
Now look at this code decompiled in dotPeek:
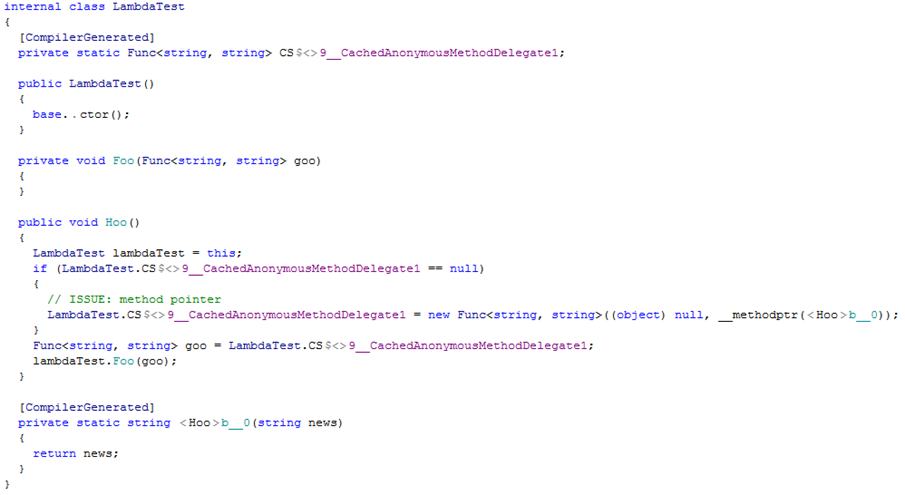
As you can see, a delegate is made static and created only once – LambdaTest.CS<>9__CachedAnonymousMethodDelegate1.
So, what pitfalls should we watch out for? At first glance, this behavior won’t generate any traffic. That’s true, but only as long as your lambda does not contain a closure. If you pass any context (this, an instance member, or a local variable) to a lambda, caching won’t work. It make sense: the context may change anytime, and that’s what closures are made for—passing context.
Let’s look at a more elaborate example. For example, your app uses some Substring method to get substrings from strings:
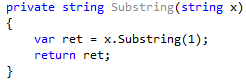
Let’s suppose this code is called frequently and strings on input are often the same. To optimize the algorithm, you can create a cache that stores results:
![]()
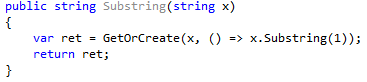
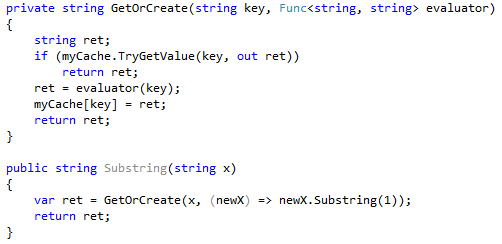
At the next step, you can optimize your algorithm so that it checks whether the substring is already in the cache:
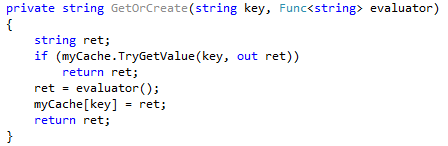
The Substring method now looks as follows:
As you pass the local variable x to the lambda, the compiler is unable to cache a created delegate. Let’s look at the decompiled code:
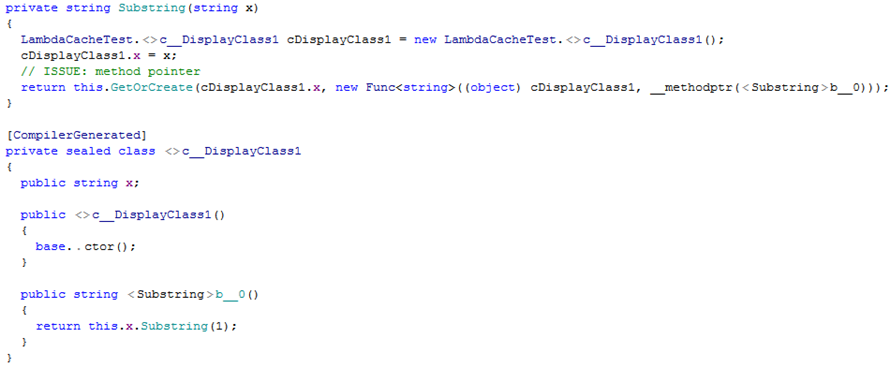
There it is. A new instance of the c__DisplayClass1() is created each time the Substring method is called. The parameter x we pass to the lambda is implemented as a public field of c__DisplayClass1.
How to Find
As with any other example in this series, first of all, make sure that a certain lambda causes you performance issues, i.e. generates huge traffic. This can be easily checked in dotMemory.
- Open a memory snapshot and select the Memory Traffic view.
- Find delegates that generate significant traffic. Objects of
…+c__DisplayClassNare also a hint. - Identify the methods responsible for this traffic.
For instance, if the Substring method from the example above is run 10,000 times, the Memory Traffic view will look as follows:
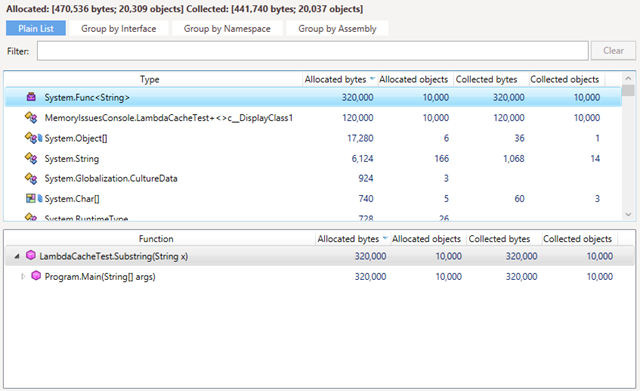
As you can see, the app has allocated and collected 10,000 delegates.
When working with lambdas, the Heap Allocation Viewer also helps a lot as it can proactively detect delegate allocation. In our case, the plugin’s warning will look like this:
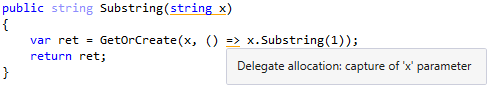
But once again, data gathered by dotMemory is more reliable, because it shows you whether this lambda is a real issue (i.e. whether it does or does not generates lots of traffic).
How to Fix
Considering how tricky lambda expressions may be, some companies even prohibit using lambdas in their development processes. We believe that lambdas are a very powerful instrument which definitely can and should be used as long as particular caution is exercised.
The main strategy when using lambdas is avoiding closures. In such a case, a created delegate will always be cached with no impact on traffic.
Thus, for our example, one solution is to not pass the parameter x to the lambda. The fix would look as follows:
The updated lambda doesn’t capture any variables; therefore, its delegate should be cached. This can be confirmed by dotMemory:
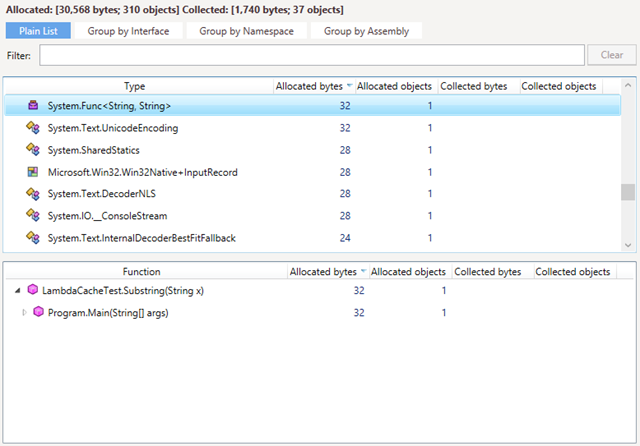
As you can see, now only one instance of Func is created.
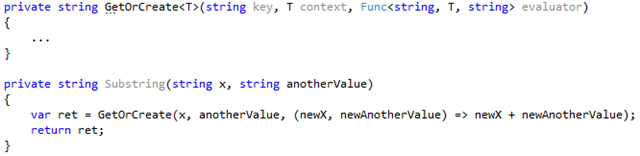
If you need to pass some additional context to GetOrCreate, a similar approach (avoiding variable closure) should be used. For example:
LINQ Queries
As we just saw in the previous section, lambda expressions always assume that a delegate is created. What about LINQ? The concepts of LINQ queries and lambda expressions are closely connected and have very similar implementation ‘under the hood.’ This means that all concerns we discussed for lambdas are also true for LINQs.
If your LINQ query contains a closure, the compiler won’t cache the corresponding delegate. For example:
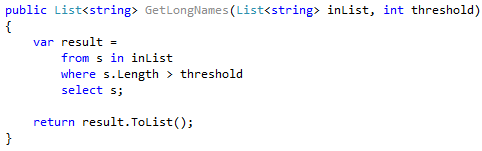
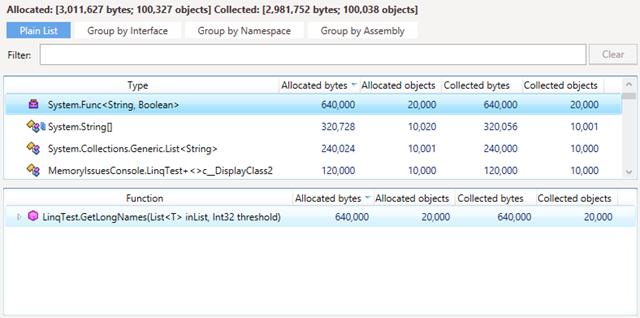
As the threshold parameter is captured by the query, its delegate will be created each time the method is called. As with lambdas, traffic from delegates can be checked in dotMemory:
Unfortunately, there’s one more pitfall to avoid when using LINQs. Any LINQ query (as any other query) assumes iteration over some data collection, which, in turn, assumes creating an iterator. The subsequent chain of reasoning should already be familiar: if this LINQ query stays on a hot path, then constant allocation of iterators will generate significant traffic.
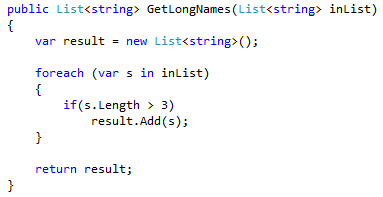
Consider this example:
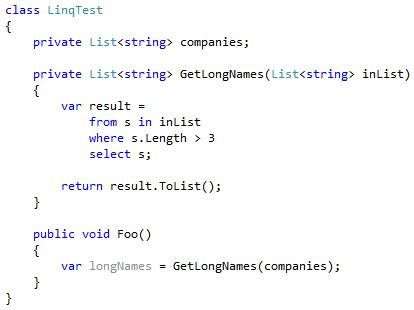
Each time GetLongNames is called, the LINQ query will create an iterator.
How to Find
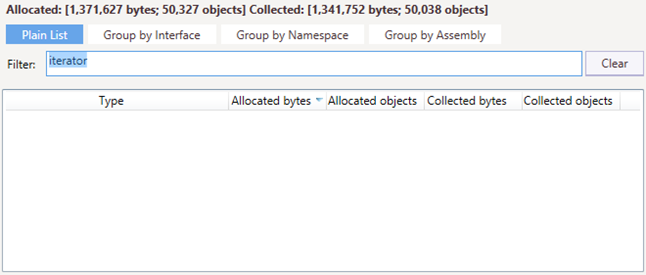
With dotMemory, finding excessive iterator allocations is an easy task:
- Open a memory snapshot and select the Memory Traffic view.
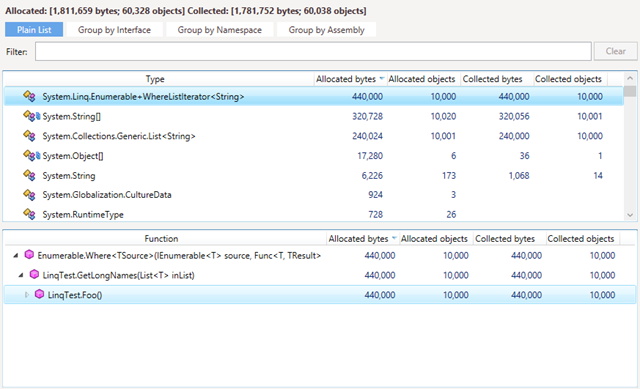
- Find objects from the namespace
System.Linqthat contain the word “iterator”. In our example we use the Where LINQ method, so we look forSystem.Linq.Enumerable+WhereListIterator<string> objects. - Determine the methods responsible for this traffic.
For instance, if we call the Foo method from our example 10,000 times, the Memory Traffic view will look as follows:
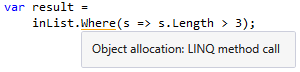
The Heap Allocation Viewer plugin also warns us about allocations in LINQs, but only if they explicitly call LINQ methods. For example:
How to Fix
Unfortunately, the only answer here is to not use LINQ queries on hot paths. In most cases, a LINQ query can be replaced with foreach. In our example, a fix could look like this:
As no LINQs are used, no iterators will be created.
We hope this series of posts has been helpful. Just in case, the previous two can be found here:
- Unusual Ways of Boosting Up App Performance. Boxing and Collections
- Unusual Ways of Boosting Up App Performance. Strings
Please follow @dotmemory on Twitter or dotMemory google+ page to stay tuned.


