.NET Tools
Essential productivity kit for .NET and game developers
dotMemory 4.1 is Released: 6+ Reasons to Upgrade
Today we are thrilled to introduce dotMemory 4.1 with a new batch of .NET memory profiling goodies regarding automatic inspections, profiling process control, GC roots data, and more. Please welcome dotMemory 4.1, bringing you more rigorous, convenient and beautiful profiling experience.

Why upgrade to dotMemory 4.1? For at least 6 reasons:
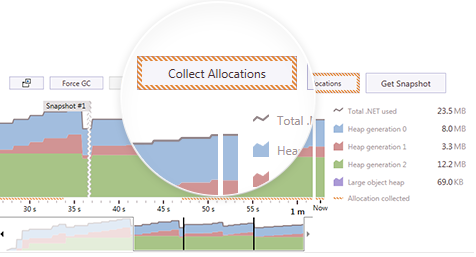
1: Disable/Enable collection allocations on the fly.
To profile certain functionality of your app without slowing down all of its other areas, try disabling allocations collection directly from the real-time profiling control view. For your convenience allocations collection period is marked by red line on a timeline.

2: Get more data on GC roots.
Starting from this update, dotMemory shows you the name of the field through which a static object is referenced. Later we plan to publish a good read on GC roots basics, so stay tuned.

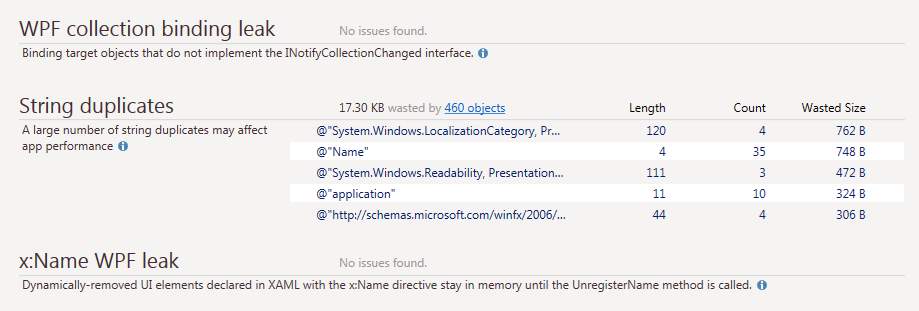
3: Detect more common issues in a single click.
To help you focus on what really needs your attention, we’ve added a new automatic inspection that finds String duplicates and shows the related memory waste. Two more recently added automatic inspections, both related to WPF, were announced earlier in v4.0.10.

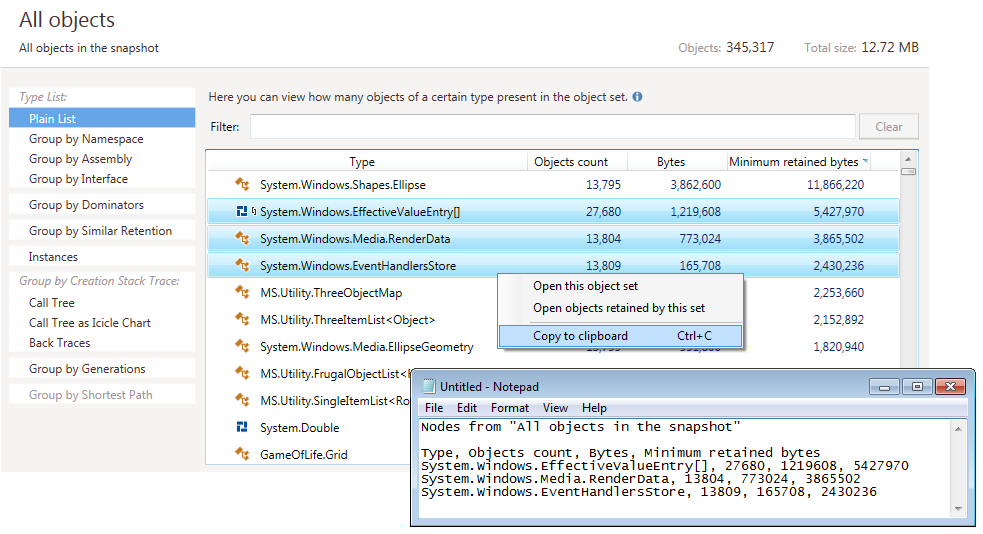
4: Copy, save and share profiling results.
Simply press Ctrl+C to copy current analysis results to the clipboard. Selection and copying of multiple rows is supported for all “Type List” views, all nicely formatted and ready to be compared or shared.

5: Enjoy new restyled UI icons. Our notion of profiling is that it should be clear, productive and even beautiful. That’s why this update features new great-looking UI icons for your viewing pleasure.
![]()
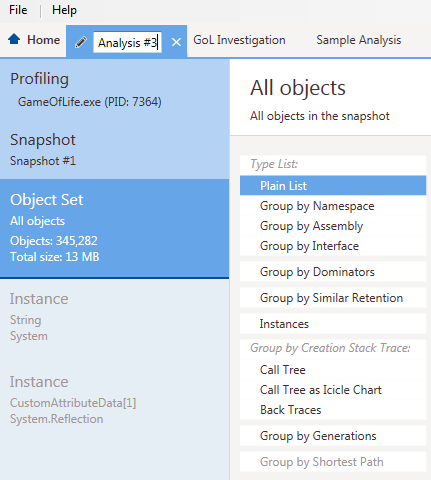
6: Name your analysis. Easily order and manage multiple memory investigations by providing your analysis tabs with custom names. Never again get lost in loads of various unnamed analyses.

+: Even more reasons?
To get the full list of enhancement and fixes, please see the release notes.
Discover all new features introduced in dotMemory 4.1 in this short Overview Demo.
Download dotMemory 4.1 and try out all the new things shipped with this update. Learn more about dotMemory 4.1 on the What’s New page. A free trial version is available for 10 actual days of use (even if they are non-consecutive). Note for existing customers: To use this update, you will need an active subscription.
Feel free to share any feedback you may have. Ask questions on the discussion forum, report bugs and feature requests to our issue tracker and/or leave comments on this blog post below. Follow @dotMemory on twitter to stay tuned about state of the art in .NET memory profiling. And to raise your skills in spotting .NET memory issues with dotMemory, watch this series of video tutorials by Maarten Balliauw, JetBrains Technical Evangelist.
Profile with pleasure!
dotMemory team


