

.NET Tools
Essential productivity kit for .NET and game developers
dotCover Command Line Tools for Automation Testing Code Coverage

The ultimate goal of creating a testing strategy is to be confident that you and your team have done their due diligence to deliver a quality product. Test harnesses typically include a mix of unit tests, integration testing, automation, and manual testing, each with advantages and disadvantages for your overall strategy. Determining the effectiveness of your plan requires data collected during test runs, and with code coverage reports, you quantify how each style of testing contributes to your confidence levels.
While code coverage is strongly associated with unit testing libraries such as xUnit, NUnit, or MSTest, the JetBrains tool dotCover can provide code coverage in many scenarios. In this post, we’ll see how to install the dotCover command line tool and gather results from any .NET process, regardless of the execution environment, including local, CI/CD, and production environments.
Getting Started with dotCover Command Line
dotCover is available as a .NET CLI tool, and you can install it in any environment where you can run a dotnet process. The command line tool supports Windows (x86/x64/ARM64), Linux (x64 / ARM / ARM64 / Musl x64 / Musl ARM64), and macOS (x64 / ARM64). You can install it either as a global or local tool.
From the command line, use the following command to install the tooling.
dotnet tool install --global JetBrains.dotCover.CommandLineTools
Confirm the tool is installed globally by running the following command.
dotnet-dotcover --help
Issues with global installations typically result from the installation folder for global tools not appearing in the PATH environment variable.
For local installation to a .NET Solution, use the following command from the root of the solution folder.
dotnet new tool-manifest
dotnet tool install --local JetBrains.dotCover.CommandLineTools
Once installed locally, run the following command from the root of your solution to verify a correct installation.
dotnet dotcover help
We’re now ready to start code coverage testing any .NET application. Also, at any point, you can learn more about any command using the following format.
dotnet dotcover help <command>
Coverage Analysis for .NET Processes
I’ve written a straightforward console application with various branching paths for this post. We’ll see if our manual testing can verify that we’ve hit all the branches correctly.
var run = true;
Console.WriteLine("Waiting for input...");
while (run)
{
var key = Console.ReadKey();
Console.Clear();
switch (key.Key)
{
case ConsoleKey.A:
Console.WriteLine("A is for 🍎");
break;
case ConsoleKey.D:
Console.WriteLine("D is for 💎");
break;
case ConsoleKey.F:
Console.WriteLine("F is for 👨🌾");
break;
case ConsoleKey.S:
Console.WriteLine("S is for 🐍");
break;
case ConsoleKey.X:
run = false;
Console.WriteLine("👋 Bye-Bye now");
break;
default:
Console.WriteLine("🤷 I have no clue");
break;
}
}
dotCover allows you to run any dotnet command under coverage analysis, with the most common entry points being exec and test. You can also start code coverage analysis on one or more currently running .NET processes.
Since this application has no unit tests, we’ll use exec to start our application and then manually attempt to hit each branch. dotCover requires that any process have PDBs available to provide coverage analysis correctly.
We’ll use the following command from the command line to start a coverage analysis session on our console application. You’ll want to change the command to point to your project’s dll.
dotnet dotcover cover-dotnet --ReportType=HTML --TargetArguments=CoverageExample.dll --Output=./
This command launches our executable under coverage analysis, waiting for an exit code to stop the session.
(base) ~/RiderProjects/CoverageExample
dotnet dotcover cover-dotnet --ReportType=HTML --TargetArguments=CoverageExample.dll --Output=./
👋 Bye-Bye now
[JetBrains dotCover] Coverage session finished [5/30/2024 1:25:02PM]
[JetBrains dotCover] Coverage results post-processing started [5/30/2024 1:25:02PM]
[JetBrains dotCover] Report generation started [5/30/2024 1:25:02PM]
[JetBrains dotCover] Report generation finished [5/30/2024 1:25:02PM]
[JetBrains dotCover] Coverage results post-processing finished [5/30/2024 1:25:02PM]
Once completed, we can open our coverage report to see if we’ve hit all the essential parts of our application logic.
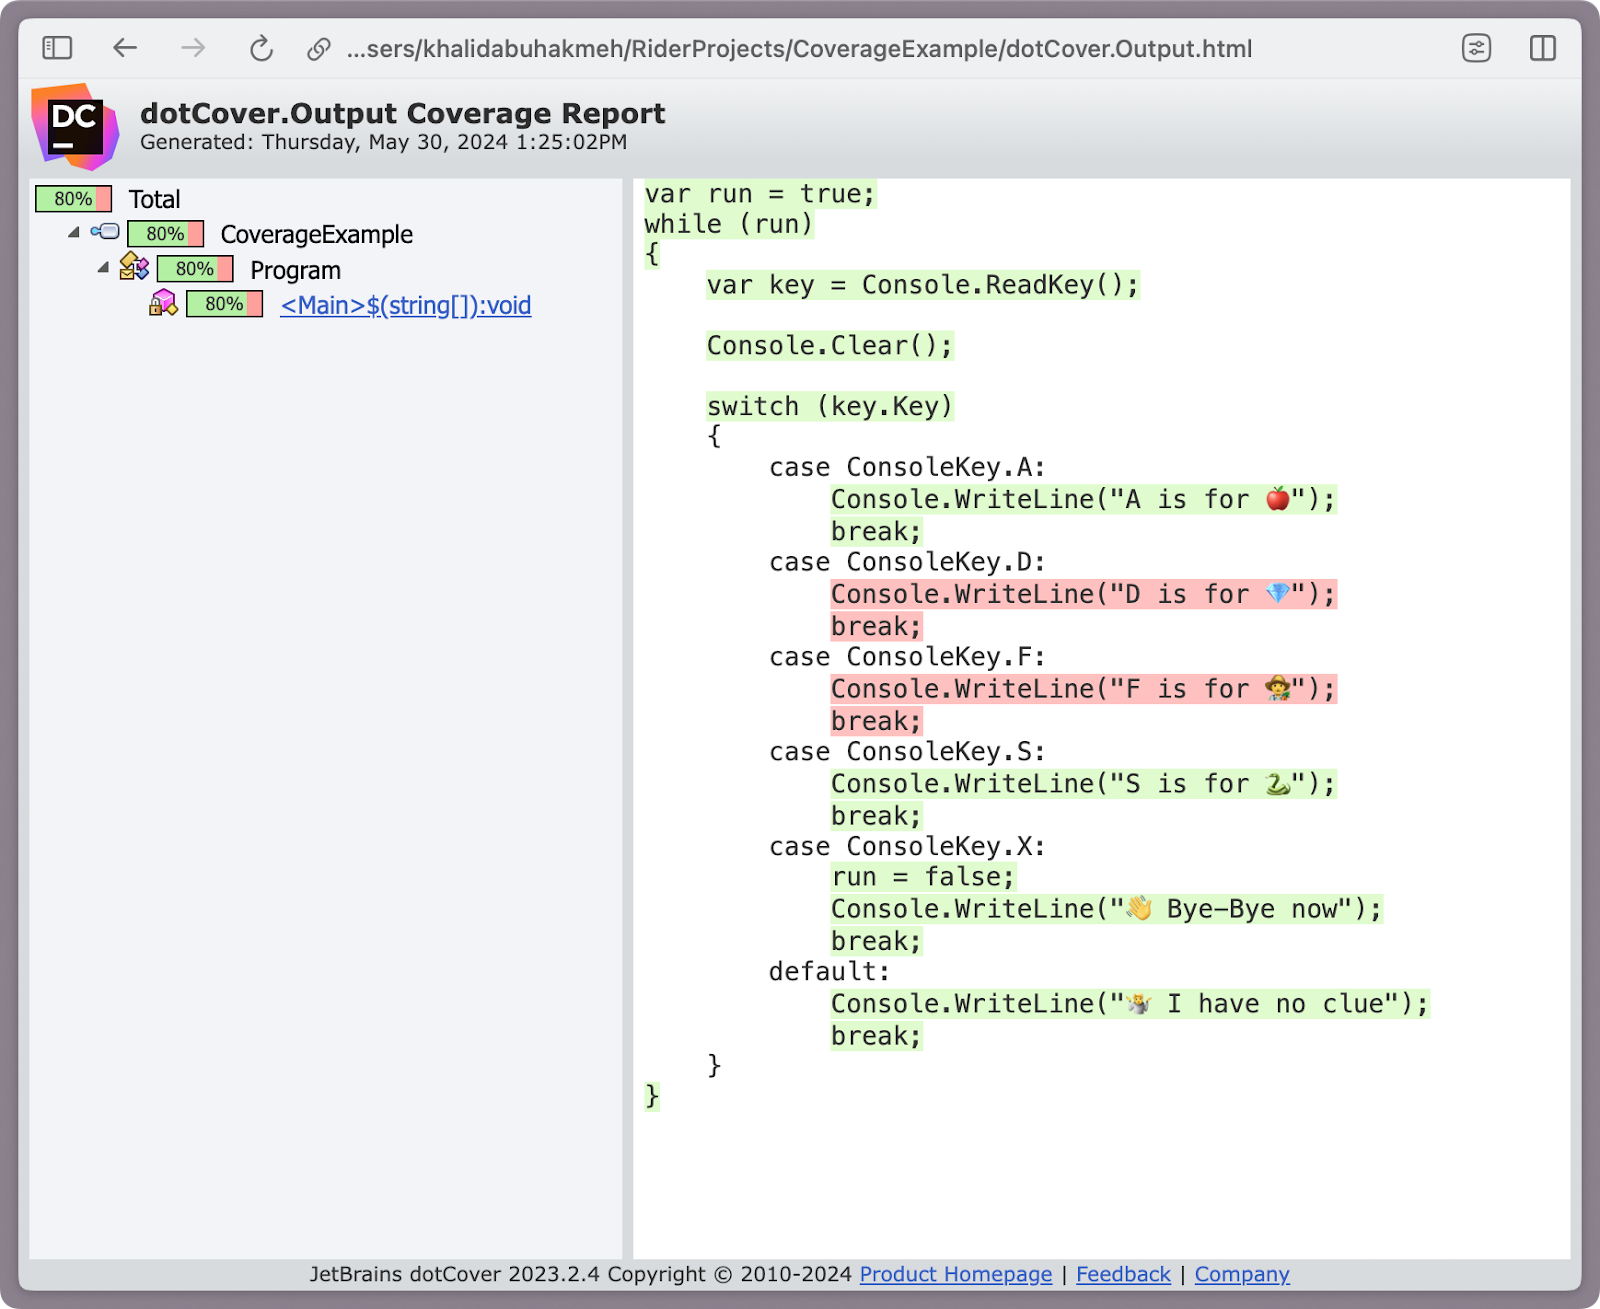
Very cool. Let’s talk about some more scenarios.
Note: You can open dotCover reports directly in ReSharper or dotCover and inspect differences between different runs.
Helpful Tips and Tricks
While manual testing with coverage analysis is a fun example, you may need more practical testing strategies. The following sections will advise setting up more complex use cases with dotCover.
Download OS-specific tooling
While installing the dotCover tooling using the dotnet CLI is convenient for development environments. You can also download an OS-specific version from our download page. The downloaded artifacts can help you build custom Docker images without needing an SDK-based base image or an internet connection to NuGet.
Change a Container’s Entry Point
Many folks rely on containerization to provide reliable and repeatable infrastructure for automation testing. As you’ve seen previously, you can use the dotnet-dotcover command to launch your .NET applications. Change your Docker images to use the dotnet-dotcover process as your new EntryPoint and use the --Output flag to write the report to a persistent volume for future retrieval.
Rival Abdrakhmanov describes this process in his blog post, “Diagnostic tools inside Docker container”.
Terminal Access to Containers
Sometimes, you can log on to running containers and execute the dotnet-dotcover command via orchestration. Terminal access can help you start and stop coverage analysis based on the lifecycle of automated tests such as Selenium or Playwright, which are a breeze to write with JetBrains Aqua.
Merging Multiple Reports into One
Regardless of the number of unique processes under coverage analysis, you can always produce a single report. Use the merge command to integrate multiple sources into a single report.
dotnet dotcover merge --source=Snapshot1.dcvr;Snapshot2.dcvr
Think about adding an XML Configuration
You can manage dotCover settings in XML, making it easier to evolve and fine-tune the coverage analysis process. Create an XML file and pass it as an argument using the --xml flag.
<ReportParams>
    <Source><!-- Coverage snapshot file name. --></Source>
    <Output><!-- Path to the resulting XML report. --></Output>
    <Output><!-- Path to the resulting JSON report. --></Output>
    <ReportType>XML</ReportType>
    <ReportType>JSON</ReportType>

    <!-- Remove auto-implemented properties from report.
    <HideAutoProperties>True</HideAutoProperties>
    -->

    <!-- Remove specified files from report. Ant-style patterns are supported here.
    <ExcludeFileMasks>
      <Mask>ProjectFolder/**/*.generated.cs</Mask>
      <Mask>ProjectFolder/**/*.tmp.cs</Mask>
    </ExcludeFileMasks>
    -->
  </ReportParams>
Don’t Forget the help command
dotCover’s built-in help menus offer great advice for every internal command. With the use of the help command, you can quickly figure out what to do, providing the support and confidence you need to use dotCover effectively.
Conclusion
As seen in this post, you can add dotCover outside typical unit testing scenarios. Adding automation testing using tools such as Selenium or Playwright doesn’t mean you have to give up on code coverage, especially with the incredible power of dotCover.
We hope you found this post helpful. Let us know if you have any questions.
image credit: Matthew Henry
Subscribe to a monthly digest curated from the .NET Tools blog:


