

IntelliJ IDEA
IntelliJ IDEA – the IDE for Professional Development in Java and Kotlin
Show Local Variables in Debugger even with no Debug Info

December is just around the corner, and this means IntelliJ IDEA 13 is coming—with many cool new features and enhancements! One of these enhancements is the new debugger feature which shows local variables even when there is no debug information for the compiled classes. This is especially helpful when debugging third-party libraries or JDK sources compiled without corresponding debug information.
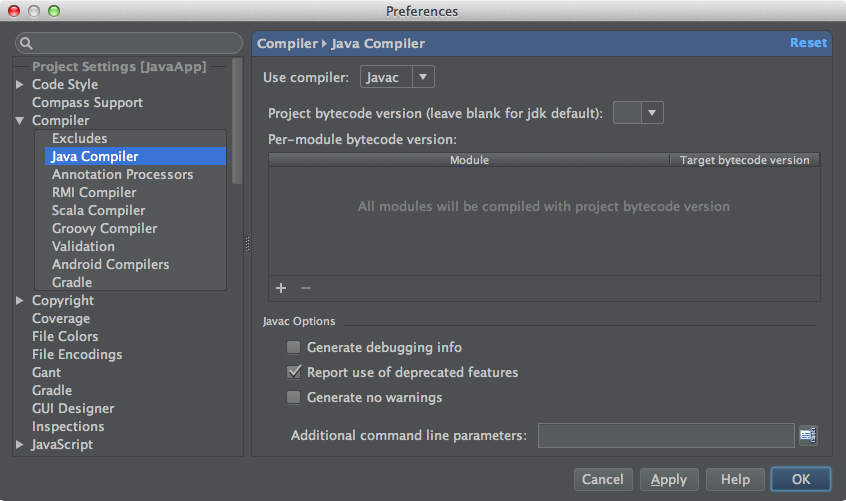
To test the new feature let’s go to Settings → Compiler → Java Compiler and turn off Generate debugging info (don’t forget to restore it afterwards):
Then you can recompile the class, add a breakpoint and start the Debug configuration.
Now when you’ve stopped at any scope with local variables defined, the IDE will try to guess how the variables correspond to slot numbers collected from the bytecode and will show matches in the Variables tab. The debugger shows only those slots that have been actually used from the method beginning up to the position at which the program has been suspended.
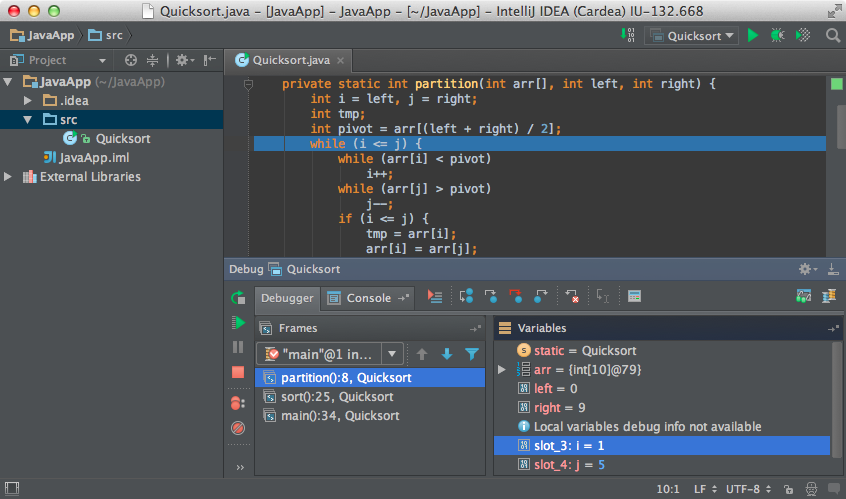
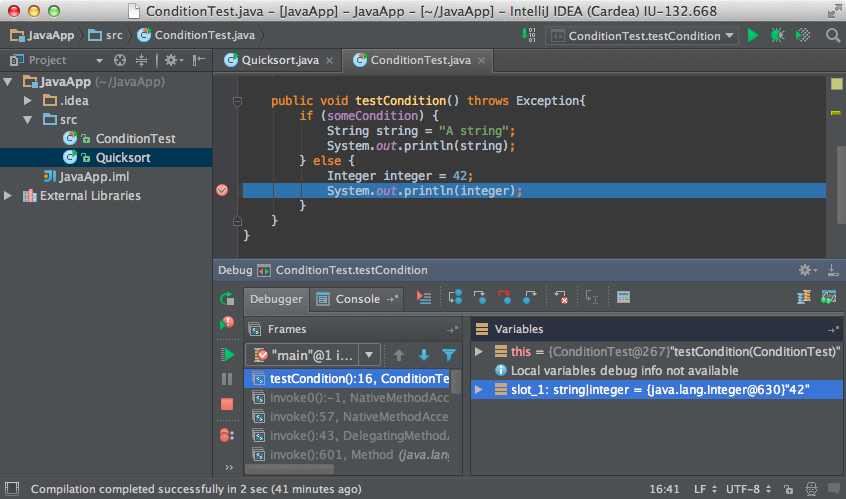
For method parameters IntelliJ IDEA can precisely map variable names from the source code. In these cases no slot number is shown. For other local variables, mapping may be inaccurate (e.g. if the sources differ from the bytecode) so the IDE shows the slot number together with the variable name. Also, some slots may be re-used for storing several local variables. In this case all possible variable names are shown for the slot.
This feature is already available in IntelliJ IDEA 13 EAP so why not go ahead and try it?
Please feel free to share your feedback on our discussion forum and submit bug reports to the issue tracker.
Develop with Pleasure!

Subscribe to IntelliJ IDEA Blog updates


