Improved Code Completion During Debugging in PhpStorm 10

Recent versions of PhpStorm have been really pushing at the boundaries with regards to the debugging tool, and PhpStorm 10 was no exception. Along with the amazing Interactive Debug Console, PhpStorm 10 also shipped various code completion improvements within the debugger.
PhpStorm 10 saw debug tool code completion added (or improved) across the board. Anywhere you may need to type class names or expressions, you’ll be presented with code completion, all within the scope of the current project.
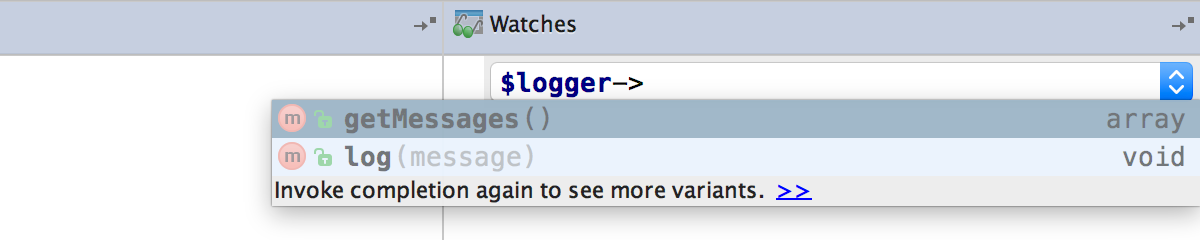
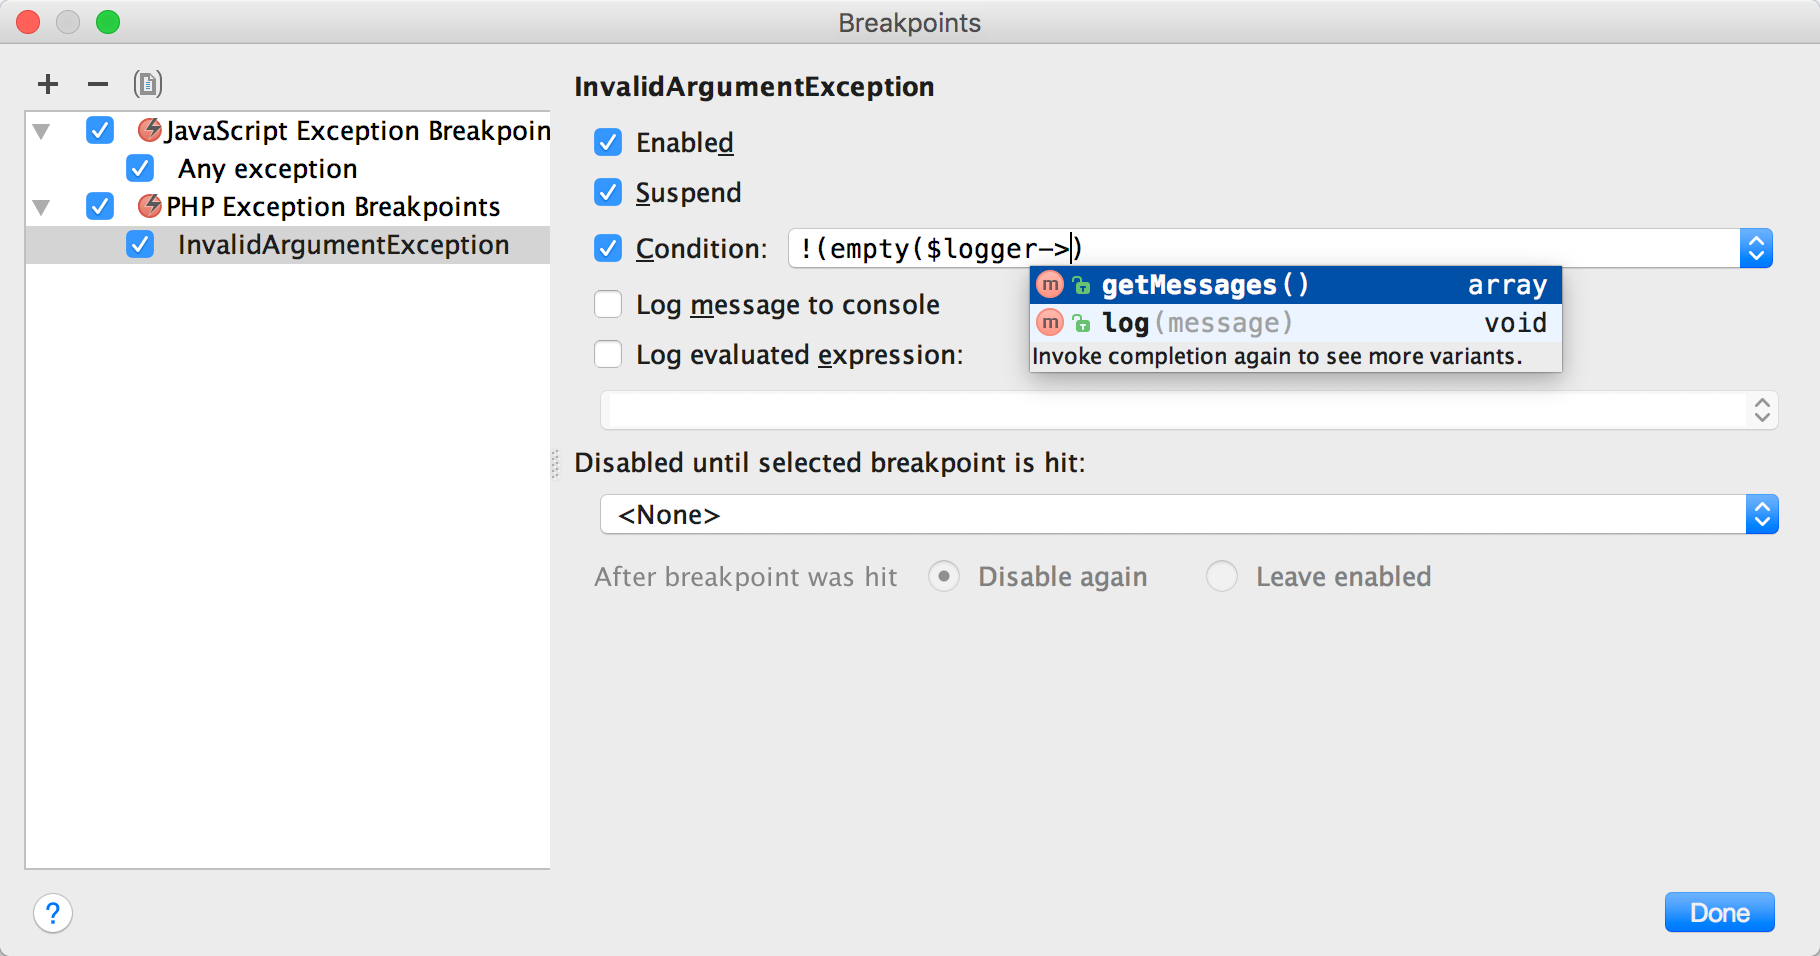
Here, you can see the code completion on the $logger object, right from within the watches pane. You’ll also get code completion in the breakpoint conditions dialog, first on the name of the exception you wish to break on, but also on the condition expression you wish to optionally use, and the evaluated expression you may want to log.
The added code completion in the debugging tool should make life easier for everyone who debugs their code using PhpStorm. Try it yourself, and let me know what you think.
Keep up with the latest PhpStorm news on our blog and follow us on Twitter @phpstorm.
Develop with pleasure!
– JetBrains PhpStorm Team