Get an Advantages of Interactive Console during Debugging in PhpStorm 9.5 EAP

Today we would like to talk about Interactive Debug Console, a new feature that is available in the current PhpStorm 9.5 EAP. With Interactive Debug Console, you can alter variables, call PHP functions, and define additional functions – all on the fly. With this simple yet powerful feature, you will find yourself in a ‘sandbox’ where you can try out expressions and snippets while staying in the debug context.
Let’s take a detailed look into how you can work with this new feature.
First, start a debug session and switch to the console frame. Please notice that Interactive Debug Console works with PHP Script, Zero-configuration, but it is not available for PHPUnit or Behat run/debug configuration.
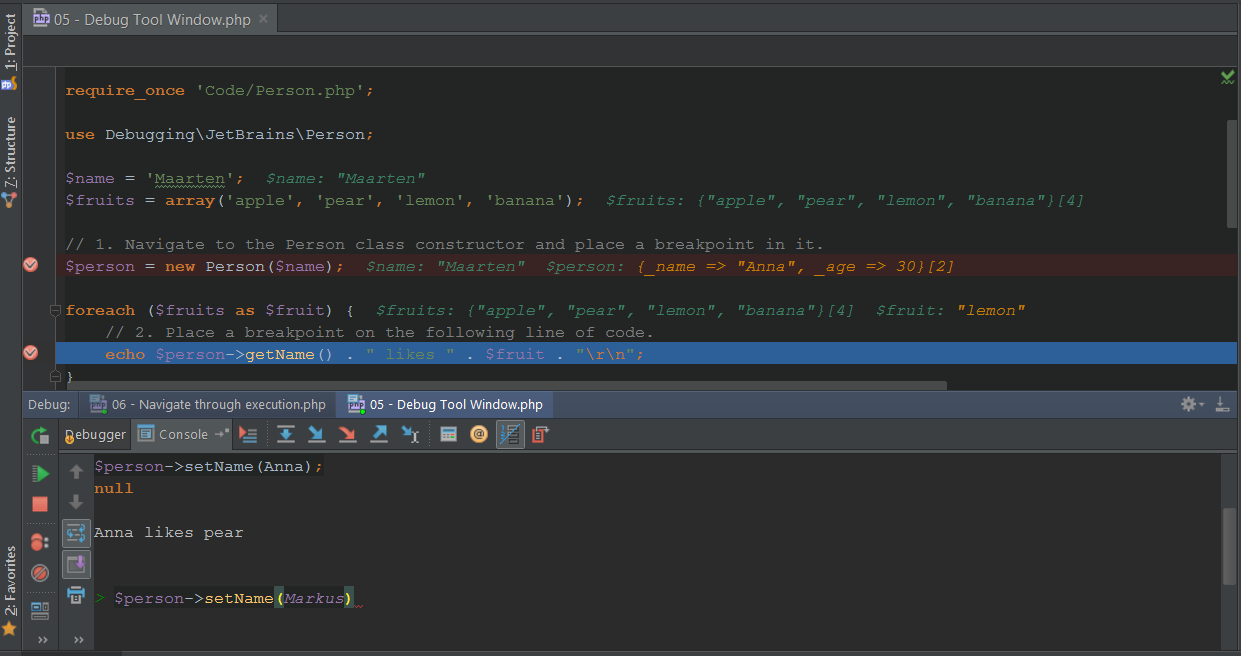
Simply start typing a statement or expression in the Console and press Enter to execute. Here we go! Your code fragment will be evaluated and the output will be shown in the Console.
Interactive Debug Console supports most PHP constructs including class declarations, function declarations, variables, expressions, etc. To make the usage of Interactive Debug Console even more effective, you can work with a multi-line code fragment. Since the Enter shortcut is reserved for executing, use Shift+Enter to create a new line and/or Ctrl+Enter to split the line.
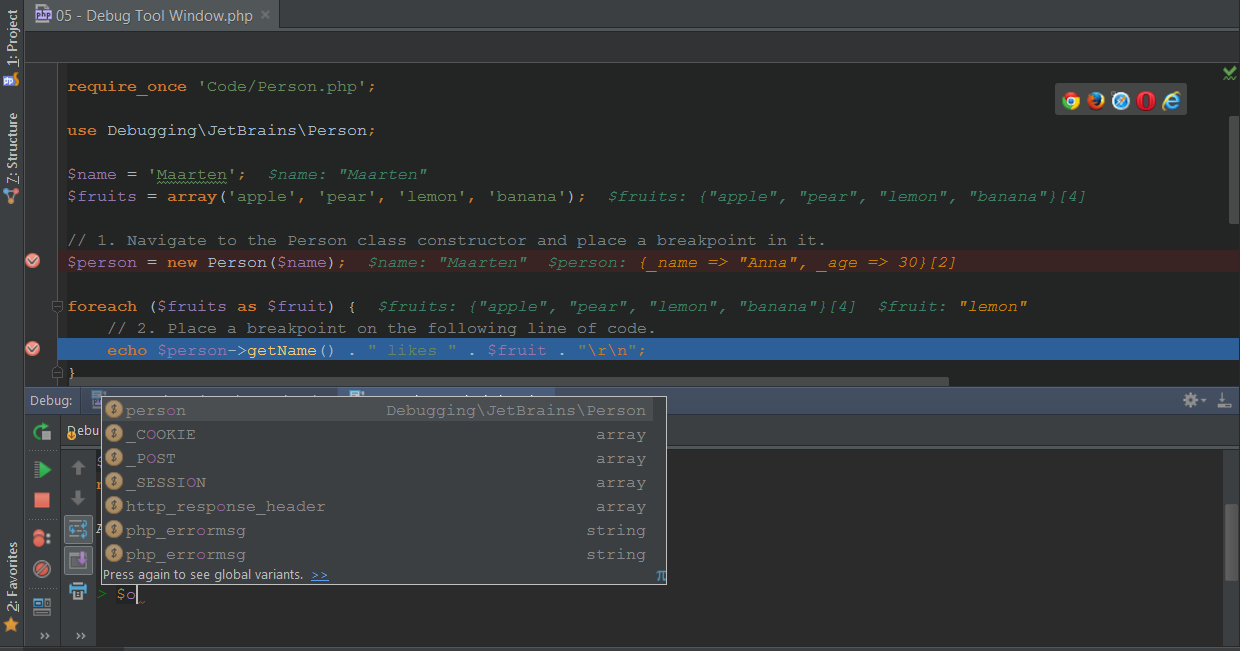
Extended code completion functionality is one of the things PhpStorm is famous for, and Interactive Debug Console is not an exception. You can enjoy almost full completion functionality within the Debug Console. This makes it incredibly easy to play with your code variables, expressions and conditions in active debugging mode.
To help you be even more productive, we created some additional functionality for arrays. Output for arrays and objects will be wrapped into a var_export() function when working in Interactive Debug Console. However, if you need it, you can easily disable this feature by opening PHP/Debug settings and deselecting the ‘Show array and object children in Debug Console’ check-box.
In addition, working with the interactive console can be very flexible as you can easily switch back to STDIN and redirect your input there instead of evaluation.
Download the latest PhpStorm 9.5 EAP and enjoy the advantages of Interactive Debug Console in your debugging sessions! Please share your thoughts, feature requests, issues and so on through the issue tracker, by posting in the comments below, or in our forums!
Debug with pleasure!
JetBrains PhpStorm Team