Zero-configuration debugging with XDebug and PhpStorm 2.0

This blog post is obsolete!
Please check new up-to-date tutorial on Zero-configuration Web Application Debugging with Xdebug and PhpStorm
Hello guys,
We have done a lot of work to simplify the debugging process in PhpStorm 2.0 and we are very grateful to our early adopters for their invaluable feedback. Let’s try a new debugging work flow in PhpStorm 2.0.
Installation of Xdebug
Make sure that you have installed Xdebug properly. Don’t forget to set the xdebug.remote_enable setting to 1. You can validate your installation using checker from xdebug.org
Prepare PhpStorm
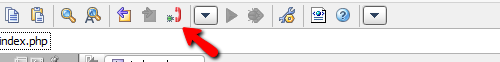
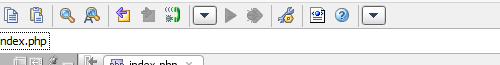
Toggle the ‘PHP Listen debug connections’ button. Don’t use any run configurations.
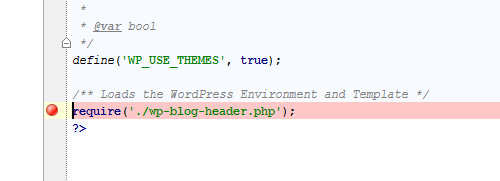
Set a breakpoint.
Activate debugger on server
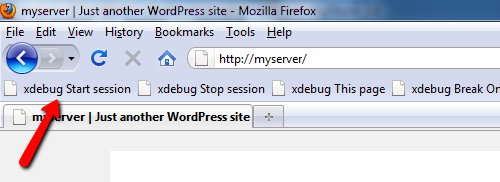
In order to activate the debugger you need to set the special GET/POST or COOKIE parameter (more details). You can do it manually, but it is much more convenient to use one of the special tools such as browser toolbars or bookmarklets for that.
Try our bookmarklets generator and get bookmarklets which will work in any modern browser and allow you to start/stop a debugging session by controlling the Xdebug cookie.
Start a debug session in browser.
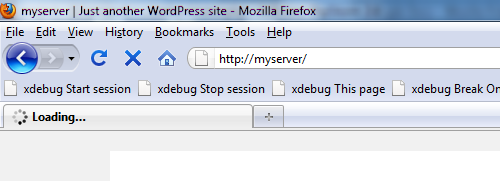
Reload the current page.
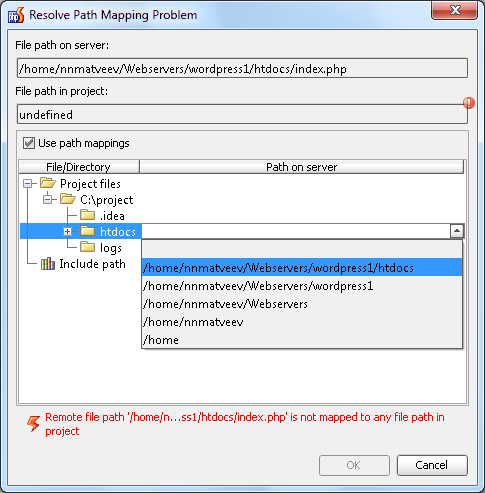
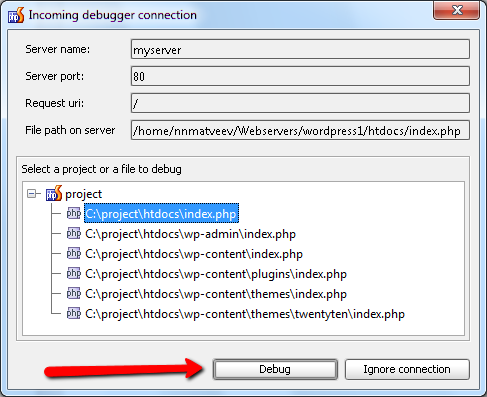
Switch to PhpStorm and set the initial path mappings by selecting the path to the local copy of the script that we are debugging. These paths are similar if you are editing files directly on the server.
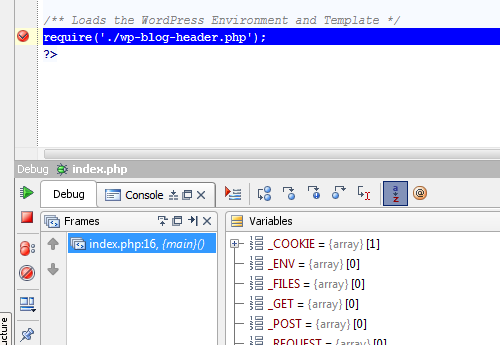
On reaching the breakpoint the debugger suspends. Now let’s investigate the application!
Troubleshooting
In some cases you may get an error message “Remote file path ‘path/to/script/on/server.php’ is not mapped to any file path in project“. This means that PhpStorm does not know which local file corresponds to the specified remote file path.
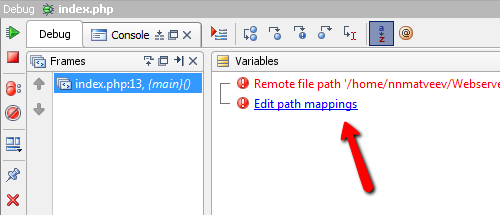
You can solve this problem quickly. Just click the ‘Edit path mappings’ link and set the necessary path mappings.