

.NET Tools
Essential productivity kit for .NET and game developers
Overview of dotTrace 6 Timeline Profiling

 In our announcement post for dotTrace 6, we introduced a new profiling method: Timeline profiling. Let’s explore what it is, how it can help us and how it compares to other profiling methods like sampling, tracing and line-by-line profiling.
We’ll also have a look at the Timeline Viewer and see how we can analyze a performance snapshot that was captured using this new profiling method.
The Timeline Profiling Method
When using timeline profiling, dotTrace collects temporal data about thread states, application events, memory allocation, garbage collections, I/O operations and other multi-threading data by using Event Tracing for Windows (ETW). Having all this information available and bound to a timeline, this profiling method is ideal for analyzing UI freezes, excessive garbage collections, uneven workload distribution, insufficient I/O and so on.
The Timeline Viewer lets us view all events and zoom in on a particular timespan of our application’s runtime. We can see which calls were made by our application, how these calls were distributed over time, on which tread they ran and when I/O was involved. We can even see the source code for the selected method, giving us all context we need to dive into the data presented.
What’s the Difference with Performance Profiling?
From a birds-eye perspective, dotTrace 6 now provides two methods of profiling applications: performance profiling and timeline profiling. In most cases, we can interchange both profiling methods. Since they both collect call stack data, we can use them to determine performance bottlenecks in our .NET applications. There are some important differences though:
- With performance profiling, dotTrace collects call stack data, data about call timings and data about the number of calls. This lets us analyze how much time is required to execute a particular method and how often it is called, and lets us trace the method call path.
- With timeline profiling, dotTrace records application events and data about how application and thread state changed during the profiling session. This lets us see what calls were made by our application, but more importantly, it also shows how these calls were distributed in time. This is very helpful when analyzing behavior of multi-threaded applications where the chronological order of events typically matters a lot. For example in determining synchronization delays, UI freezes and so on.
Timeline profiling is less suitable for measuring exact call numbers of every statement. As a rule of thumb, use performance profiling if the analysis leans more to finding the slowest method in an application, and use timeline profiling to identify the cause of UI freezes and the effects of garbage collection, I/O and other multithreading issues like irregular work distribution, lock contention, serialized execution, and other.
More information about the differences between both profiling methods is available in the web help.
Timeline Profiling an Application
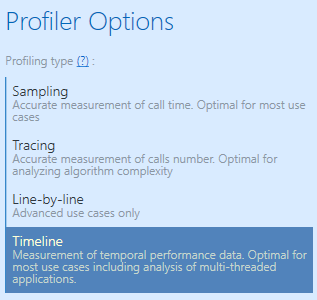
After downloading, installing and starting dotTrace 6, we have two options to start profiling an application. If integration with Visual Studio is enabled, we can use the ReSharper | Profile | Profile Startup Project (Performance) menu from there. dotTrace can also be launched standalone, after which we can use the home screen to start a profiling session. Make sure to provide the path to the executable to profile, and select Timeline as the profiling type.
After clicking Run, our application will be launched with the profiler attached. The profiling controller window also opens, which we can use to start and stop collecting snapshot data, kill the application that’s being profiled and more. We can expand the controller window to view real-time memory and CPU usage and the processes involved in the profiling session.
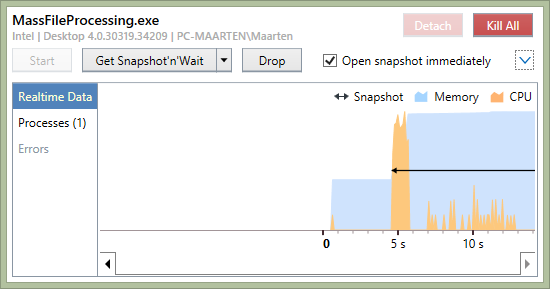
After reproducing an issue in our application, for example by evoking a UI freeze or following the steps someone provided in a bug report, we can collect a timeline profiling snapshot by clicking Get Snapshot’n’Wait in the controller window. This will open the Timeline Viewer in which we will analyze the snapshot we’ve just captured.
Analyzing a Snapshot using the Timeline Viewer
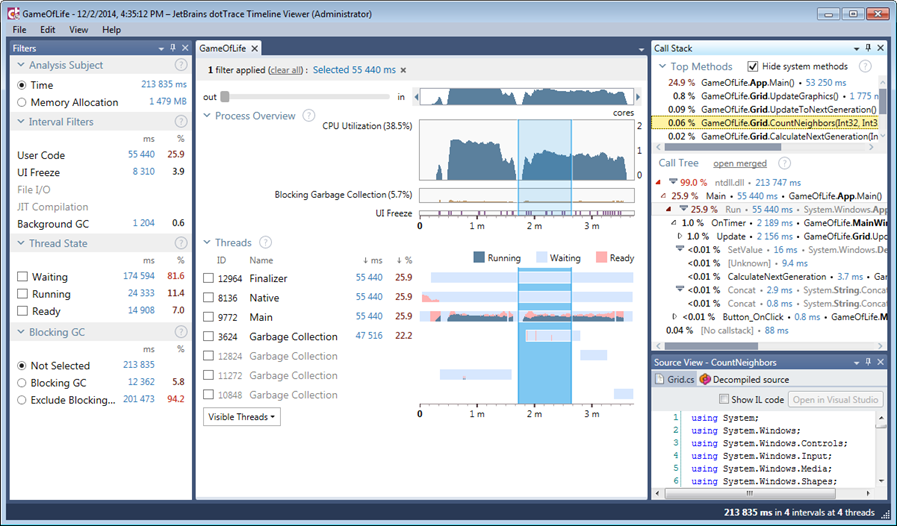
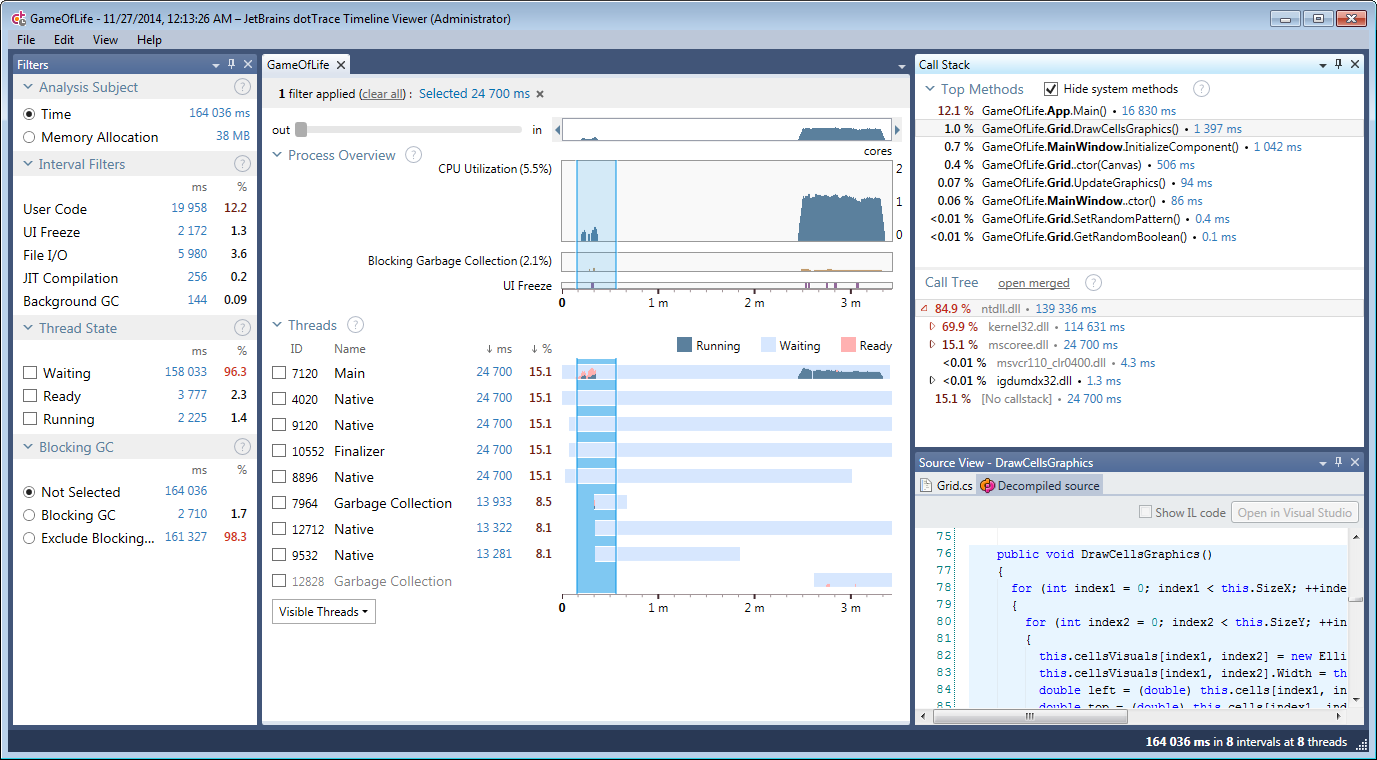
Once a snapshot is opened, either by capturing a fresh one or opening a previously captured snapshot from the dotTrace Home, we will see the Timeline Viewer and its components. Please note that depending on contained data snapshot processing can take a while. Since the main idea behind timeline profiling is collecting temporal call stack and thread state data, the timeline diagram takes a prominent place showing CPU utilization across various threads over time.
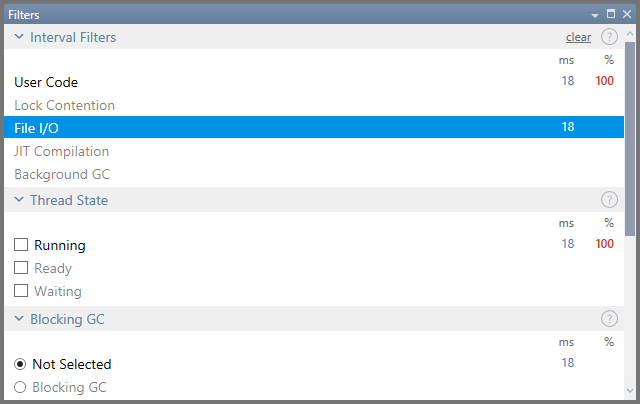
Analyzing a snapshot using the Timeline Viewer is done by applying filters. Pretty much every tool window can be used to set a filter. The most logical filter tool window is, well, the filter tool window. Imagine we’re interested in seeing only File I/O, we can click that and if needed, specify more fine-grained options like a specific file or the access method (read/write).
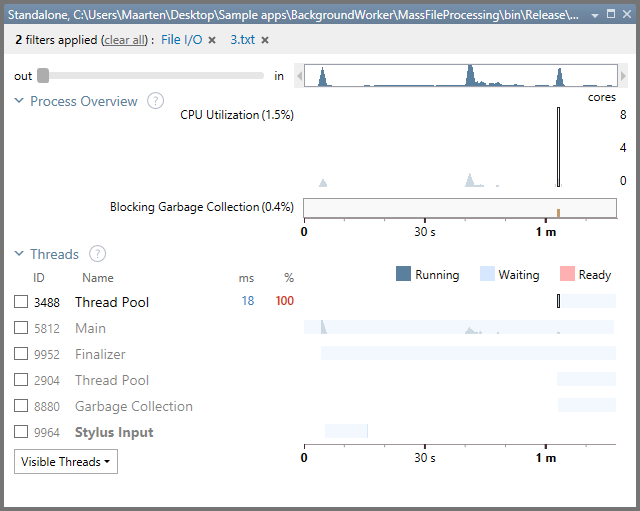
Selecting a filter in one tool window applies it in all the other tool windows. In our example here, filtering File I/O on the file 3.txt tells us where in our application’s runtime the file was accessed if we look at the Timeline Diagram. Our I/O seems to have happened at a little more than 1 minute in, on the thread with ID 3488. Again, we can apply more filtering here. We could select just that thread and show only data for it. Or zoom in on the timeline and select just the timespan where this file was accessed. Or both. No matter what, we’re applying additional filters if we do that.
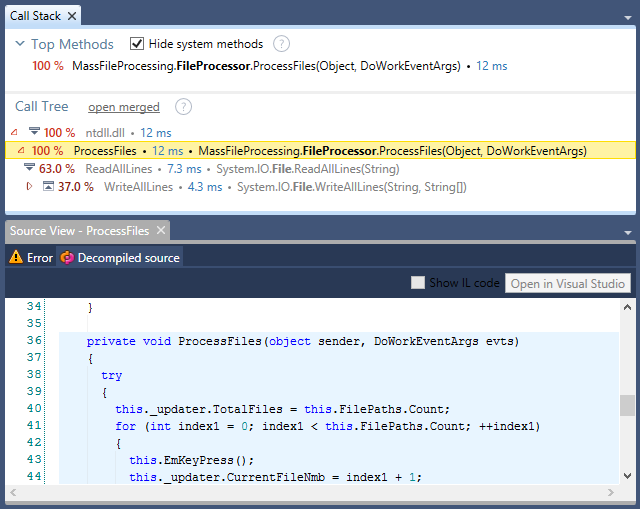
In the Call Stack tool window, we can find the call tree for everything that happened in our application during the selected timespan, on a thread with ID 3488, related to File I/O on the file named 3.txt. We can see a method named ProcessFiles spent time reading and writing files. In the Source View tool window, we can even see the source code for that method obtained by looking for PDB files or by decompiling our application’s assembly.
By combining filters, we can find the information we want and investigate almost every aspect of our application.
Give dotTrace 6 a try, there’s a free trial available! We have a tutorial available that helps getting started with Timeline Profiling in dotTrace 6, and a more advanced one where we analyze an application issue. We’re looking forward to your feedback! Comments, issues and suggestions are welcome in our issue tracker or through the comments below.


