

.NET Tools
Essential productivity kit for .NET and game developers
Timeline Profiling inside Visual Studio

With each new release, dotTrace deepens its integration with ReSharper and Visual Studio. In doing this, we aim to lower the entry barrier and make profiling easier to use on a daily basis, by moving profiling closer to code. dotTrace 10 has come the farthest in this regard, as this release integrates the entire Timeline Viewer into Visual Studio.
The viewer is represented with the Performance Profiler tool window, exposing functionality that is almost identical to that of its standalone counterpart.
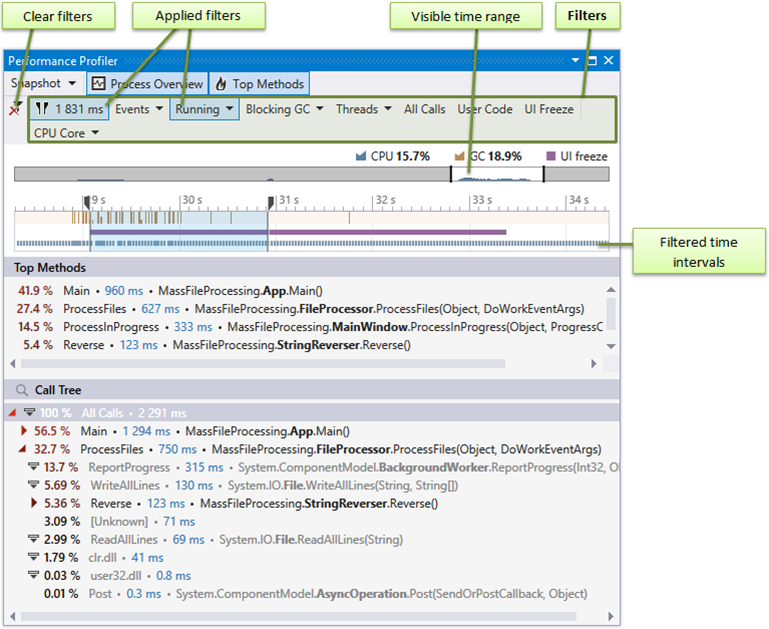
What are the pros of using the integrated viewer?
- First of all, the timeline profiling workflow becomes virtually seamless as you run a session and analyze results right in Visual Studio. You no longer need to switch between the source code and the profiler.
- The next game changer is the ability to navigate from the call tree to the source code…

…and vice versa:

In the latter case you not only navigate to Call Tree, but also apply a filter by all method occurrences and their subtrees.
Some differences between the Performance Profiler window and the standalone viewer:
- With a more compact UI, filters are grouped in a slightly different way.
- A tiny difference in Call Tree shortcuts is that in the integrated viewer, Enter navigates you to the method declaration.
- Threads Diagram is not available in the integrated viewer. For thread selection, you can use either the Threads filter or the Threads tool window (for multiple thread selection).

Try the integrated viewer on your own by installing the latest ReSharper Ultimate build and let us know how you like it!


