
Tips & Tricks


Analyzing External Thread Dump
If you’ve happened to use IntelliJ IDEA‘s Analyze Stacktrace feature to investigate someone else’s stack traces, you’ll like the way it is extended in the latest IntelliJ IDEA EAP.
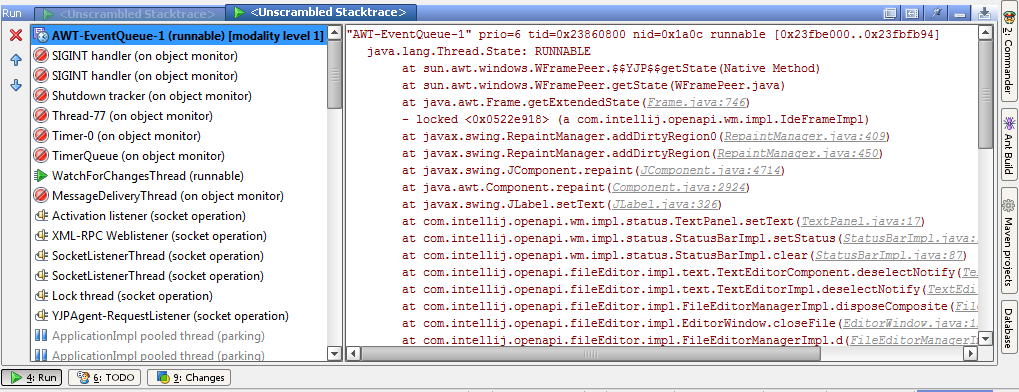
You can now paste an entire thread dump to the Analyze | Analyze Stacktrace… dialog. IntelliJ IDEA will present all threads in a readable way and sort them so that those, most probably responsible for the deadlock or “hang”-problem in question, will be listed first.
Subscribe to IntelliJ IDEA Blog updates


