IntelliJ IDEA
IntelliJ IDEA – the Leading IDE for Professional Development in Java and Kotlin
Profile Java and Kotlin Code with the IntelliJ Profiler

At JetBrains, we believe that profiling Java and Kotlin code should be simple and accessible to all developers, regardless of their level of expertise. That’s why the IntelliJ Profiler puts ease of use and seamless integration at the forefront of its mission.
In previous releases, we introduced a range of features to support these efforts. These include a single out-of-the-box configuration that spares you tedious setup, as well as the Home tab of the Profiler tool window. This tab makes it easy to attach the profiler to a running process.
We’re continuing on our mission to simplify profiling, and we want to share some of our progress with you.
Start profiling with the IntelliJ Profiler
Fast start
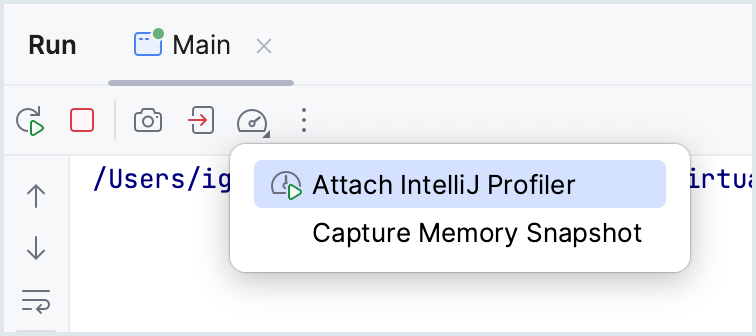
First, you can now attach the profiler and capture a memory dump for a running Java or Kotlin program right from the Run tool window:
Find synchronization issues and bottlenecks
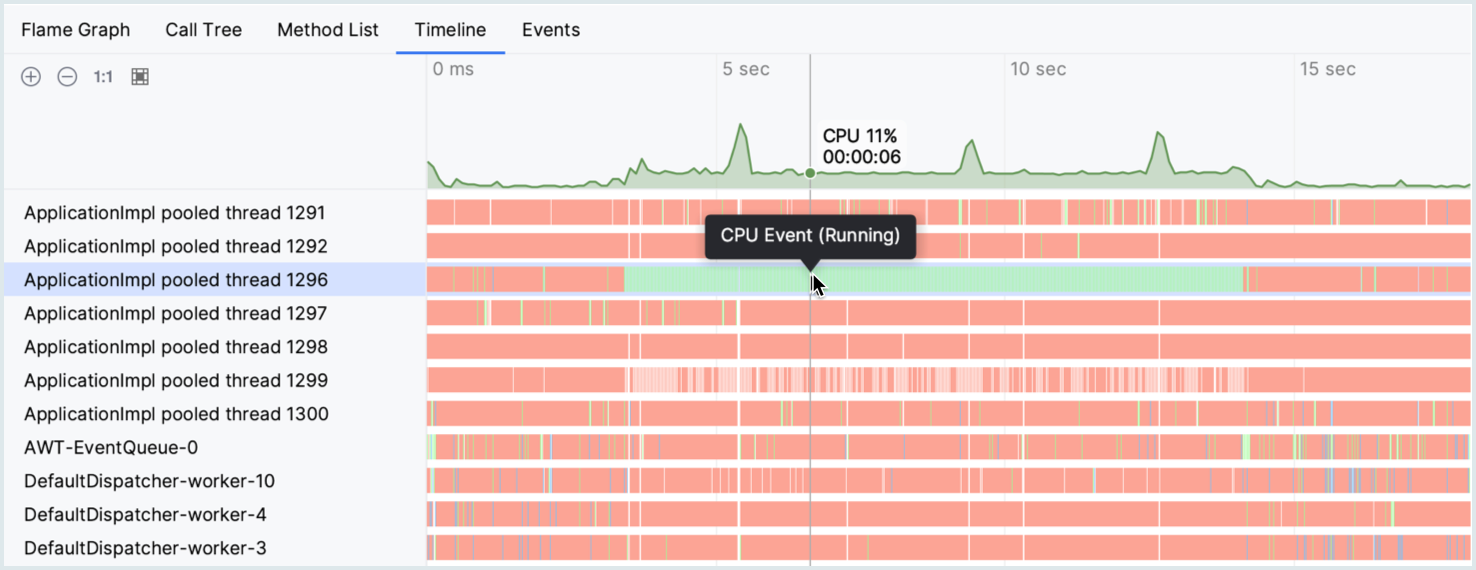
Second, the profiling report has become more informative. The default configuration now also profiles sleeping and waiting threads. This enables you to detect synchronization issues and external bottlenecks like long service calls and other I/O interactions. Together with milliseconds as the new default measurement unit, this makes profiling more intuitive and transparent.
On the screenshot below, you can see a timeline with color-coding for threads’ busy states (green) and waiting states (red):
In-editor performance hints
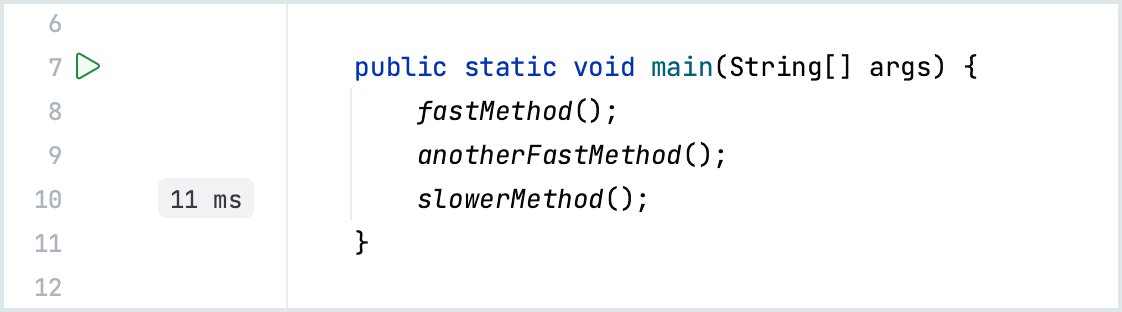
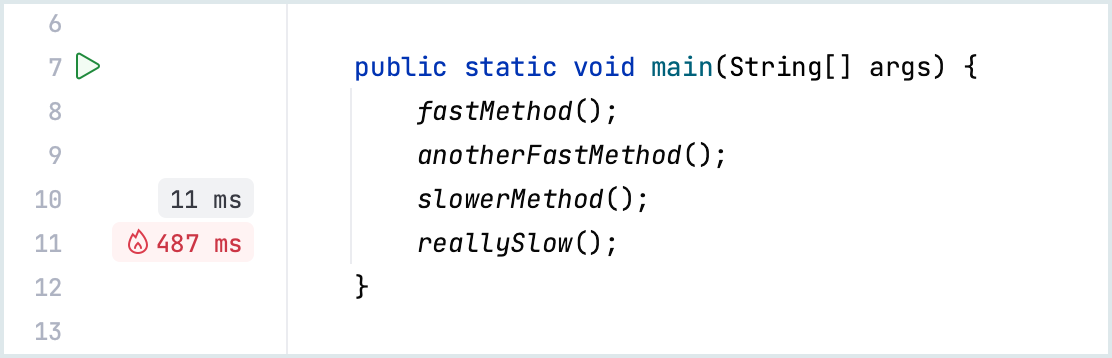
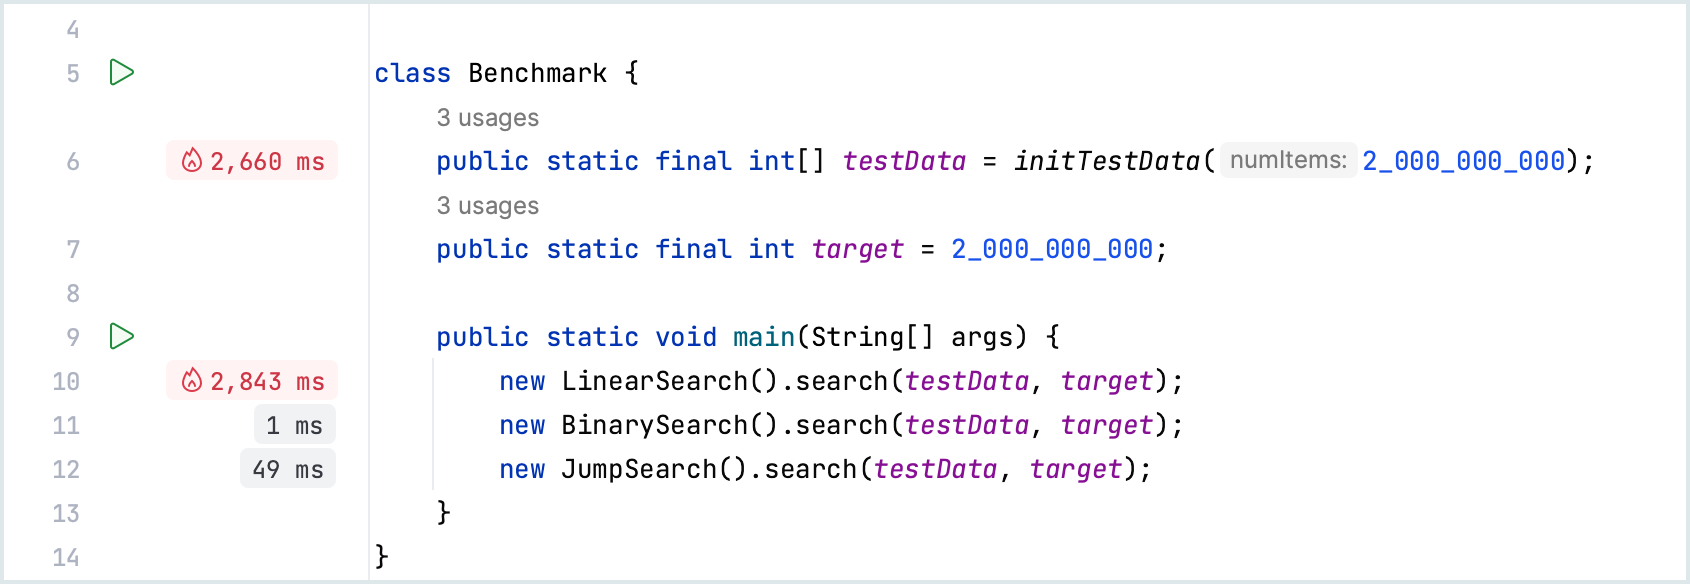
Finally, in a particularly exciting update, you no longer need to leave your code to view profiling data. When you open a snapshot, lines of code that took a significant amount of time to execute are labeled with their respective runtimes.
Hot lines are indicated with a distinctive red fire icon:
Clicking on a label takes you directly to its declaration, enabling you to examine the method’s implementation in detail and pinpoint slow lines. If this does not give you enough granularity, you can continue to drill down until you find the root cause.

While this feature can definitely be used in large-scale projects, we hope that it will be equally useful for novice users and smaller problems like evaluating the performance of a LeetCode submission.
If you need more advanced views, like Flame Graph and Call Tree, you can still access them through the Profiler tool window.
If you’re new to profiling and interested in these updates, don’t hesitate to give the new features a try. To learn about more advanced techniques and in-depth profiling with IntelliJ IDEA, we recommend following these tutorials:
- Get started with CPU profiling – In this tutorial you’ll learn how to improve Java application performance in a few simple steps.
- Find a memory leak – Troubleshoot a real Java application with the IntelliJ Profiler.
More exciting improvements are on their way, so stay tuned!