IntelliJ IDEA
IntelliJ IDEA – the Leading IDE for Professional Development in Java and Kotlin
Touring Plugins: Software Metrics

IntelliJ IDEA is a platform on to which most functionality is provided in the form of plugins. IntelliJ IDEA Ultimate has all the functionality our other IDEs have (with the exception of iOS/OSX-targeted functionality in AppCode). Each smaller IDE in turn is pretty much a cut-down tailored version of IntelliJ IDEA targeting a specific set of functionality. WebStorm for instance focuses on HTML, JavaScript, Node.js, etc. PhpStorm adds PHP to the mix.
In addition to all the built-in plugins by JetBrains, there are tons of other functionality and features available in the form of plugins. In fact, did you know that, as of writing this post, there are 1182 plugins available in our plugin repository? I’m sure there are even a few around the net that haven’t been published yet.
Plugins in the repository are categorized by functionality, although the easiest way to find something we’re looking for is to just search in free form text. For each entry we get information about the vendor, rating, number of downloads, etc.
Starting with this issue, we’re going to look at some different plugins that are available. We’ll be focusing on plugins that aren’t bundled and active out of the box. We’ll look at the forgotten ones!
Also, remember that the easiest way to install plugins (and search for them) is via IntelliJ IDEA (or sister IDEs) directly, under Plugins. You can browse the JetBrains plugin repository or add custom ones.
Metrics Reloaded
Metrics Reloaded is a neat plugin that provides us with a wealth of metrics about our project. From cyclomatic complexity to class cohesion, it really offers good insight into our project structure. The plugin itself is OSS and the source code is available on GitHub.
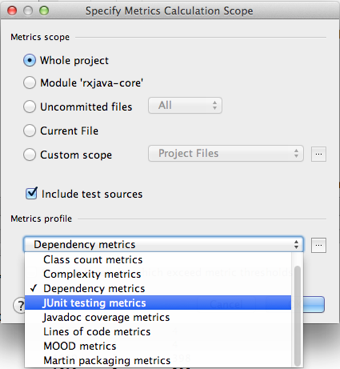
Once installed, it provides us with a menu option under Analyze|Calculate Metrics. Metrics can be run for an entire project, a specific module, uncommitted files, current file, or a even a custom scope, making it extremely flexible in terms of what it is we want to analyze. It even provides us with the ability to filter out our tests.
In terms of the actual types of metrics, we can calculate:
- Chidamber-Kemerer. Information on object coupling, inheritance depth, cohesion between methods (or thereof lack of), number of subclasses amongst other metrics introduced by Chidamber and Kemerer.
- Class count. Provides information on the number of total classes, product classes, i.e. those that are not part of tests, and classes that are part of the testing code.
- Dependency. Very detailed metrics on dependencies. It provides information about cyclic dependencies and transitive dependencies of classes, as well as dependents on each class.
- Complexity. Details of cyclomatic complexity, essential complexity, and extended cyclomatic dependencies of methods.
- JUnit Testing. Provide information on the number of JUnit test assertions and methods.
- Javadoc Coverage. Simple count of the number of lines of Javadoc.
- Lines of Code. Much like classes, it provides a total count of lines of code as well as production versus test code distribution.
- MOOD. The six metrics under the MOOD umbrella, including Method Hiding factor, Attribute Inheritance, Method Hiding, Method Inheritance, and Polymorphism factor.
- Martin Packaging. Refers to the series of metrics that Robert C. Martin a.k.a. Uncle Bob, mentions in his book Agile Software Development: Principles, Patterns and Practices. These metrics are mostly related to class and package coupling, providing information such as Afferent and Efferent couplings between classes, abstractness, instability and distance from main sequence. You can find more information about these metrics under Software package Metrics.
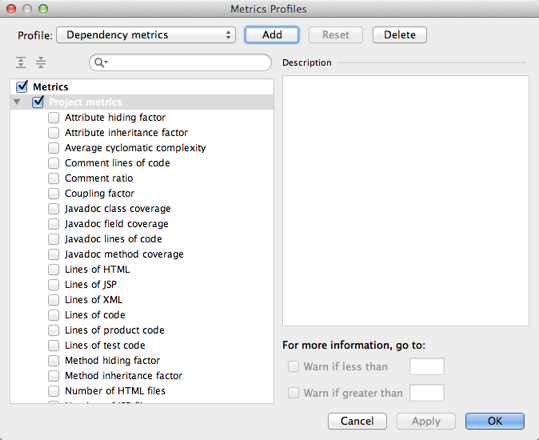
In addition to the built-in metrics, we can also define our own selection of metrics. By clicking the ellipsis next to the Metrics dropdown, we can access the Metric Profiles windows. This not only allows us to create custom metrics, but also to define the threshold values, which can then be used to only show values that pass a certain threshold. (By default, everything is shown although those passing threshold are marked in red.)
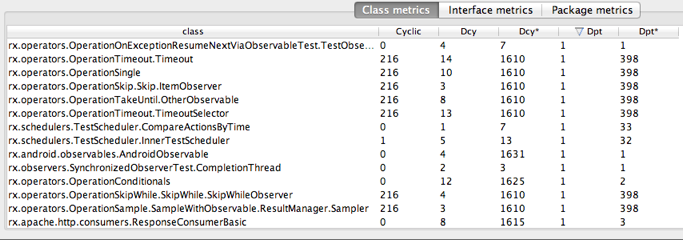
Here’s the output of running the Dependency metrics:
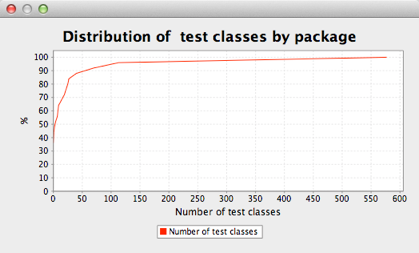
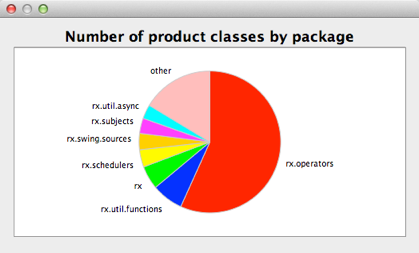
If we right-click the columns, we’re also offered the option to see a Distribution Diagram or a Histogram of the values, a pie chart (where applicable), as well as learn more about the actual metrics collected.
Distribution
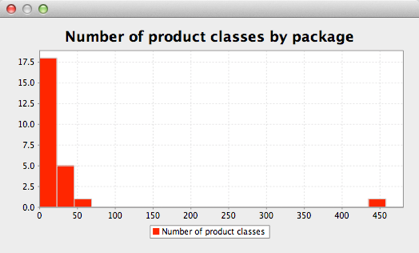
Histogram
Pie Chart
While the concept of metrics in software development is at times controversial, many of the statistics provided with this plugin are useful to the potential issues in the code, in an objective way.
To install it, just search for MetricsReloaded under the Browse Repositories option in the Plugins configuration.