
JetBrains Platform
Plugin and extension development for JetBrains products.
扩展 Qodana:添加自定义代码检查

Qodana 是一款静态代码分析工具,将 JetBrains IDE 中的代码检查和快速修复功能引入持续集成领域。它可以在云端运行、通过 Docker 容器执行、集成到 CI/CD 管道中,也可以通过 JetBrains IDE 调用。
Qodana 已提供一套完善的检查,但它并不局限于内置检查。您可以添加自定义检查,以强制实施项目特定规范和约定。
例如,假设一个项目采用特定的代码约定:
service软件包中的每个 Kotlin 类都必须有Service后缀。
在这种情况下,com.jetbrains.service.JetComponent 不符合此约定,而 com.jetbrains.service.BrainComponentService 则完全符合此约定。接下来,我们将构建一个实现此检查的插件,让 Qodana 能够在今后的项目中强制遵循这项约定。
我们可以通过创建一个封装到插件中的自定义代码检查来实现此代码约定。Qodana 插件的开发方式与 JetBrains IDE 插件相同,也就是说,我们只需创建一个可以在 Qodana 中运行的 IntelliJ Platform 插件。以下是我们将采取的步骤的快速概述:
- 通过 IntelliJ Platform 插件模板初始化项目。
- 调整项目属性、插件描述符以及必要的依赖项。
- 在插件描述符中声明局部检查,并使用 Kotlin 实现检查。
- 构建插件并进行封装。
- 在示例演练场项目中,将插件工件放入适当的目录。
- 调整 Qodana 配置文件。
- 运行 Qodana 并查看报告!
准备插件项目
要初始化项目,请访问 IntelliJ Platform 插件模板仓库,并点击 Use this template(使用此模板)按钮创建插件仓库。将其命名为 classname-inspection-qodana-plugin,复制项目 URL,并在 IntelliJ IDEA 中打开项目。项目准备就绪后,根据需要声明 pluginGroup、pluginName 和 pluginRepositoryUrl,以自定义 gradle.properties。记得点击 Sync Gradle Changes(同步 Gradle 更改)悬浮式按钮应用更改。要修改独一无二的插件标识符,请在插件描述符 plugin.xml 中更改 id 元素。
声明依赖项
我们的代码检查针对的是 Kotlin 类,因此,我们需要将 Kotlin 插件添加到 Qodana 插件的依赖项。gradle.properties 文件需要声明:
platformBundledPlugins = org.jetbrains.kotlin
此外,插件描述符 plugin.xml 必须在其依赖项中包含相同的捆绑 Kotlin 插件:
<depends>org.jetbrains.kotlin</depends>
再次提醒,请务必点击悬浮式按钮同步 Gradle 更改。
此外,Kotlin 类检查需要支持 Kotlin K2 编译器,自 2025.1 版 IntelliJ Platform 起,该编译器默认启用。在插件描述符中,声明 org.jetbrains.kotlin.supportsKotlinPluginMode 扩展。
<extensions defaultExtensionNs="org.jetbrains.kotlin">
    <supportsKotlinPluginMode supportsK2="true" />
</extensions>
创建代码检查
针对 Kotlin 类的任何代码检查的实际代码需要三个步骤:
- 在插件描述符中声明
com.intellij.localInspection扩展,同时声明必要的特性,以及对实现类的完全限定引用。 - 创建实现类,最好使用 Kotlin。
- 提供包含检查描述、用法指导和示例的独立 HTML 文件。
声明扩展
向 plugin.xml 插件描述符文件添加以下声明:
<extensions defaultExtensionNs="com.intellij">
    <localInspection
        language="kotlin"
        implementationClass="org.intellij.sdk.codeInspection.ServicePackageClassNameInspection"
        enabledByDefault="true"
        displayName="SDK: Discouraged class name"
        groupName="Kotlin"
    />
</extensions>
language 特性指示检查适用于 Kotlin 源代码文件。务必明确默认启用检查,否则 Qodana 将不会运行此检查。然后,提供人类可读的描述性 displayName,以显示在报告和设置中。groupName 特性用于设置将在 Qodana 报告和 IDE 设置中显示的检查类别。最后,为实现类提供完全限定名称。
代码检查源代码
Kotlin 插件为 Kotlin 检查提供了一个实用的基础检查类:AbstractKotlinInspection。重写 buildVisitor 方法,并提供一个 PSI 访问器实例,该实例以类型安全的方式遍历 Kotlin 类元素。classVisitor 是一个类似 DSL 的便捷函数,会返回这种类型的 PSI 访问器,并在您检查的项目中的任何 Kotlin 类上调用。
package org.intellij.sdk.codeInspection

import com.intellij.codeInspection.ProblemHighlightType
import com.intellij.codeInspection.ProblemsHolder
import com.intellij.psi.PsiElementVisitor
import org.jetbrains.kotlin.idea.codeinsight.api.classic.inspections.AbstractKotlinInspection
import org.jetbrains.kotlin.psi.KtClass
import org.jetbrains.kotlin.psi.KtVisitorVoid
import org.jetbrains.kotlin.psi.classVisitor

class ServicePackageClassNameInspection : AbstractKotlinInspection() {
    override fun buildVisitor(holder: ProblemsHolder, isOnTheFly: Boolean) = classVisitor { klass ->
        val classNamePsi = klass.nameIdentifier ?: return@classVisitor
        val classFqn = klass.fqName?.asString() ?: return@classVisitor
        if (klass.packageLastComponent == "service" && !classFqn.endsWith("Service")) {
            holder.registerProblem(
                classNamePsi,
                "Class name in the 'service' package must have a 'Service' suffix"
            )
        }
    }

    private val KtClass.packageLastComponent: String
        get() = containingKtFile.packageFqName.shortName().asString()
}
该访问器子类会提取 Kotlin 完全限定类名,检查最右侧的软件包元素,并检查相应的后缀。任何不合适的类名都会被上报给 ProblemsHolder 实例,上报时会提供封闭类作为 PSI 元素,并提供人类可读的问题描述。
检查描述
每个局部检查都需要一个以 HTML 格式呈现的配套描述文件。如果您使用 Create description file ServicePackageClassNameInspection.html 快速修复,将在适当的位置创建名为 src/main/resources/inspectionDescriptions/ServicePackageClassName.html 的文件。您还需要提供将在 Qodana 报告和 IDE 设置中显示的描述。
<html>
<body>
Reports class names in the <code>service</code> packages that lack the <code>Service</code> suffix.
<p><b>Example:</b></p>
<pre><code>
  package com.example.foo.service
  class SomeComponent {
    /* class members */
  }
</code></pre>
</body>
</html>
构建插件
一切就绪 – 该开始构建了! 执行 buildPlugin Gradle 任务,并查看 Gradle 输出目录中的 build/distributions/qodana-code-inspection-0.0.1.zip 工件。该 JAR 文件将用作 Qodana 扫描中的主要工件。
请记住该插件工件类型
Qodana 不直接支持包含附加 JAR 归档或第三方依赖项的本地 ZIP 插件工件。任何插件都需要打包为单个 JAR 文件,或解压到特定目录中。
在演练场项目上运行 Qodana
我们来创建一个使用 Kotlin 编写的演练场项目,由于我们已通过插件对 Qodana 进行了扩展,现在可以使用 Qodana 进行检查。要在本地运行 Qodana 插件,请确保您的系统上安装了以下两个软件组件:
我们的演练场项目应包含名为 src/main/kotlin/org/intellij/sdk/qodana/service/SomeComponent.kt 的类,该类不遵循我们的代码约定,因为它没有 Service 后缀。可以通过两种方式将 Qodana 插件集成到 Qodana 中:
- 在 JetBrains Marketplace 上发布
- 为了加快周转速度,可以将插件的 JAR 工件放在您的项目的
.qodana目录中。
为了简化构建过程,可以将 build/distributions/qodana-code-inspection-0.0.1.zip 文件从插件项目复制到演练场项目的 .qodana/qodana-code-inspection-0.0.1.zip 文件。如果 .qodana 目录不存在,请创建此目录。然后,使用首选程序或工具提取归档。Qodana 能够访问 build/distributions/qodana-code-inspection 目录中的插件。
此外,需要将 Qodana 配置为包含我们的自定义代码检查。按照以下方式更改演练场项目根目录中的 qodana.yaml 文件:
version: "1.0"
linter: qodana-jvm-community
include:
  - name: org.intellij.sdk.codeInspection.ServicePackageClassNameInspection
include 块需要引用插件中提供的代码检查的完全限定类名。现在,请在终端中执行以下命令来运行 Qodana:
qodana scan --volume $PWD/.qodana/qodana-code-inspection:/opt/idea/custom-plugins/qodana-code-inspection
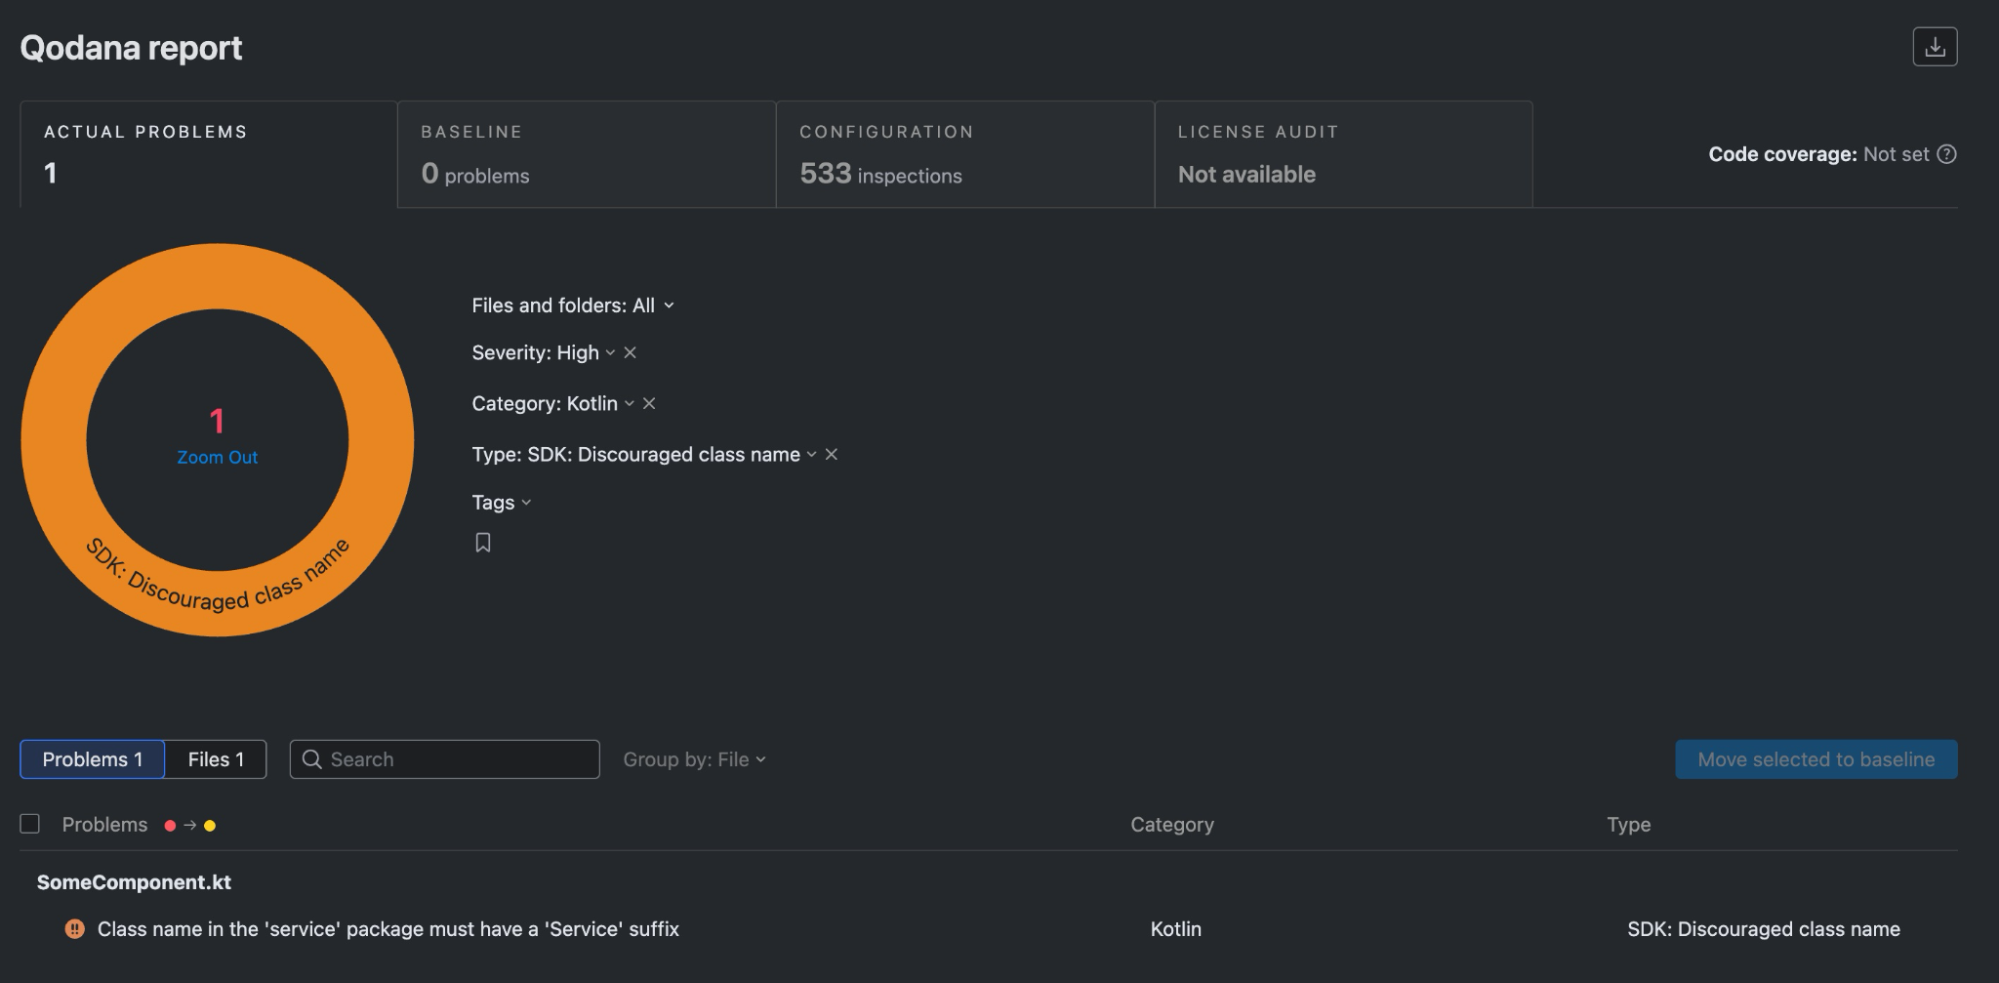
这将下载相应的 Qodana Docker 镜像。将基于 Qodana 配置创建 Docker 容器并运行此容器。要使自定义插件可在 Qodana 运行时访问,请将本地文件系统中的 Qodana 插件目录挂载到 Qodana Docker 容器内的相应目录。几分钟后,Qodana 将生成报告摘要,并将其打印到标准输出。
Qodana - Detailed summary
Analysis results: 1 problem detected
By severity: High - 1
-------------------------------------------------------
Name                           Severity  Problems count
-------------------------------------------------------
SDK: Discouraged class name    High      1
-------------------------------------------------------
在浏览器中打开完整报告:
  Do you want to open the latest report [Y/n]Yes

!  Press Ctrl+C to stop serving the report

  Showing Qodana report from http://localhost:8080/... (10s)
Qodana 将显示 SomeComponent 不符合 Qodana 插件中局部检查提供的代码约定。
后续运行的提示
修改并重新构建 Qodana 插件时,也需要重新创建 Qodana 缓存。在此类情况下,使用 --clear-cache CLI 开关重新加载 Qodana 运行的所有依赖项。
qodana scan --clear-cache --volume $PWD/.qodana/qodana-code-inspection-0.0.1.jar:/opt/idea/custom-plugins/codeinspection.jar
将 Qodana 插入到您的 IDE
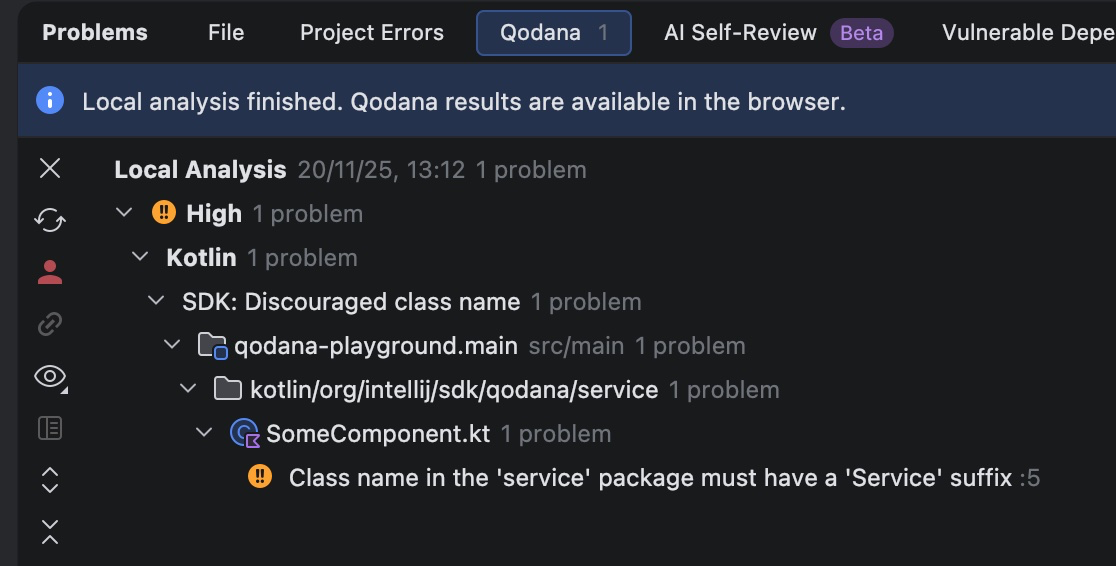
Qodana 插件可以通过磁盘安装到 IDE 中。它的代码检查随后会自动启用,并为项目中的任何 Kotlin 类调用。要检查它是否正常运行,请重新访问演练场项目,打开 org.intellij.sdk.qodana.service.SomeComponent 类,并确保存在问题的类名已添加下划线。为方便起见,将鼠标悬停在类名上方将显示代码检查结果以及问题描述。您也可以打开 Problems(问题)工具窗口,在代码检查报告的所有问题列表中找到该问题。
代码检查现在的表现与 IDE 提供的其他任何检查完全一致。在 Settings | Editor | Inspections | Kotlin(设置 | 编辑器 | 检查 | Kotlin)中,您将找到 SDK: Discouraged class name(SDK: 不建议的类名)检查,以及来自于我们之前提供的 HTML 文件的描述。
在 IDE 中运行 Qodana
插件安装完毕后,您现在还可以通过 IDE 运行 Qodana。在 Problems(问题)工具窗口中,前往 Qodana 标签页,并点击 Try Locally(在本地试用)按钮。Qodana 将通过 qodana.yaml 文件进行配置并运行。可以直接在工具窗口中找到 Qodana 报告。
Qodana 插件和 JetBrains Marketplace
正确构建并经过测试的自定义检查插件可以发布到 JetBrains Marketplace,无需通过 .qodana 目录提供。您只需确保 Qodana 配置指定与插件描述符中的 id 元素匹配的公共插件标识符。
version: "1.0"
linter: qodana-jvm-community
plugins:
  - id: com.github.novotnyr.qodanacodeinspection
Qodana 的 scan 命令得到了简化,因为 .qodana 目录挂载不再是必须执行的步骤。
qodana scan
Qodana 会从 JetBrains Marketplace 下载此插件,并运行其所有检查,生成控制台输出以及可以在 Web 浏览器中显示的 HTML 报告。
总结
我们已创建包含代码检查的 Qodana 插件,它可以检查特定的代码约定,并且可以通过多种方式运行此插件:
- 作为放置在
.qodana目录中并包含在 Qodana YAML 文件中的 JAR。 - 作为对 JetBrains Marketplace 上公开提供的插件的引用。
- 作为安装在 IDE 中的 JAR,此时,会在本地 Qodana 运行中应用检查。
- 作为安装在 IDE 中的 JAR,此时,检查包含在集成代码检查中。
有关 Qodana 插件和演练场项目的简洁示例,请参见 IntelliJ SDK 代码示例
本博文英文原作者:
Subscribe to JetBrains Platform updates
Discover more


Extending Qodana: Adding Custom Code Inspections
Qodana is a static code analysis tool that brings code inspections and quick-fixes from JetBrains IDEs to the realm of continuous integration. It can be run in the cloud, executed from a Docker container, integrated into CI/CD pipelines, or invoked through a JetBrains IDE.
Qodana already offers an impressive suite of inspections, but it is not limited to what comes built in. You can add custom inspections to enforce project specifics and conventions.
For example, imagine a project with a specific code convention:
Each Kotlin class in a
servicepackage must have aServicesuffix.
In this case, com.jetbrains.service.JetComponent would not conform to this convention, while com.jetbrains.service.BrainComponentService would be perfectly fine. In what follows, we’ll build a plugin that implements this inspection, allowing Qodana to enforce this convention in future projects.
We can implement this code convention by creating a custom code inspection packaged in a plugin. Qodana plugins are developed just like JetBrains IDE plugins, which is to say we simply need to create an IntelliJ Platform plugin that can be run in Qodana. Here’s a quick overview of the steps we’ll take:
- Initialize the project from the IntelliJ Platform Plugin Template.
- Adjust the project properties and plugin descriptor along with necessary dependencies.
- Declare the local inspection in the plugin descriptor and implement it in Kotlin.
- Build and package the plugin.
- In the example playground project, put the plugin artifact into a proper directory.
- Adjust the Qodana configuration file.
- Run Qodana and look at the report!
Preparing the plugin project
To bootstrap the project, visit the IntelliJ Platform Plugin Template repository and click the Use this template button to create a plugin repository. Name it classname-inspection-qodana-plugin, copy the project URL, and open it in IntelliJ IDEA. When the project is ready, customize gradle.properties by declaring the pluginGroup, pluginName, and pluginRepositoryUrl as necessary. Remember to click the Sync Gradle Changes floating button to apply the changes. To modify the unique plugin identifier, change the id element in the plugin descriptor plugin.xml.
Declaring dependencies
Our code inspection targets Kotlin classes, so we need to add the Kotlin plugin to the Qodana plugin’s dependencies. The gradle.properties file requires you to declare:
platformBundledPlugins = org.jetbrains.kotlin
In addition, the plugin descriptor plugin.xml must contain the same bundled Kotlin plugin in its dependencies:
<depends>org.jetbrains.kotlin</depends>
Again, remember to sync Gradle changes by clicking the floating button.
In addition, the Kotlin class inspection needs to support the Kotlin K2 Compiler, which has been enabled by default since version 2025.1 of the IntelliJ Platform. In the plugin descriptor, declare the org.jetbrains.kotlin.supportsKotlinPluginMode extension.
<extensions defaultExtensionNs="org.jetbrains.kotlin">
    <supportsKotlinPluginMode supportsK2="true" />
</extensions>
Creating the code inspection
The actual code for any code inspection that targets Kotlin classes requires three steps:
- Declare a
com.intellij.localInspectionextension in the plugin descriptor along with the necessary attributes and a fully qualified reference to the implementation class. - Create an implementation class, preferably in Kotlin.
- Provide a standalone HTML file with an inspection description, usage guidelines, and an example.
Declaring the extension
Add the following declaration to the plugin.xml plugin descriptor file:
<extensions defaultExtensionNs="com.intellij">
    <localInspection
        language="kotlin"
        implementationClass="org.intellij.sdk.codeInspection.ServicePackageClassNameInspection"
        enabledByDefault="true"
        displayName="SDK: Discouraged class name"
        groupName="Kotlin"
    />
</extensions>
The language attribute indicates that the inspection applies to Kotlin source code files. It is important to explicitly enable the inspection by default; otherwise, Qodana will not run it. Then provide a human-readable descriptive displayName to be shown in the report and settings. The groupName attribute sets the inspection category that is shown both in the Qodana report and in the IDE settings. Finally, provide a fully qualified name for the implementation class.
Code inspection source code
The Kotlin plugin provides a useful base inspection class for Kotlin inspections: AbstractKotlinInspection. Override the buildVisitor method and provide a PSI visitor instance that traverses the Kotlin class elements in a type-safe way. classVisitor is a convenient DSL-like function that returns this kind of PSI visitor and is invoked on any Kotlin class in the project you’re inspecting.
package org.intellij.sdk.codeInspection

import com.intellij.codeInspection.ProblemHighlightType
import com.intellij.codeInspection.ProblemsHolder
import com.intellij.psi.PsiElementVisitor
import org.jetbrains.kotlin.idea.codeinsight.api.classic.inspections.AbstractKotlinInspection
import org.jetbrains.kotlin.psi.KtClass
import org.jetbrains.kotlin.psi.KtVisitorVoid
import org.jetbrains.kotlin.psi.classVisitor

class ServicePackageClassNameInspection : AbstractKotlinInspection() {
    override fun buildVisitor(holder: ProblemsHolder, isOnTheFly: Boolean) = classVisitor { klass ->
        val classNamePsi = klass.nameIdentifier ?: return@classVisitor
        val classFqn = klass.fqName?.asString() ?: return@classVisitor
        if (klass.packageLastComponent == "service" && !classFqn.endsWith("Service")) {
            holder.registerProblem(
                classNamePsi,
                "Class name in the 'service' package must have a 'Service' suffix"
            )
        }
    }

    private val KtClass.packageLastComponent: String
        get() = containingKtFile.packageFqName.shortName().asString()
}
The visitor subclass extracts the fully qualified Kotlin class name, inspects the rightmost package element, and checks the corresponding suffix. Any improper class name is reported to the ProblemsHolder instance with an enclosing class as a PSI element and a human-readable problem description.
Inspection description
Each local inspection requires a companion description file, represented as HTML. If you use the Create description file ServicePackageClassNameInspection.html quick-fix, a file named src/main/resources/inspectionDescriptions/ServicePackageClassName.html will be created in the proper location. You’ll also have to provide a description that will be shown in the Qodana report and in the IDE settings.
<html>
<body>
Reports class names in the <code>service</code> packages that lack the <code>Service</code> suffix.
<p><b>Example:</b></p>
<pre><code>
  package com.example.foo.service
  class SomeComponent {
    /* class members */
  }
</code></pre>
</body>
</html>
Build the plugin
You’re all set – time to build! Execute the buildPlugin Gradle task and look at the build/distributions/qodana-code-inspection-0.0.1.zip artifact available in the Gradle output directory. The JAR file will be used as the primary artifact in the Qodana scan.
Keep the plugin artifact type in mind
Qodana does not directly support local ZIP plugin artifacts that include additional JAR archives or third-party dependencies. Any plugin needs to be packaged as a single JAR or unzipped into a specific directory.
Run Qodana on a playground project
Let’s create a playground project, written in Kotlin, that we can inspect with Qodana now that we’ve extended it with our plugin. To run the Qodana plugin locally, make sure that two software components are available on your system:
Our playground project should contain a class called src/main/kotlin/org/intellij/sdk/qodana/service/SomeComponent.kt, which does not follow our code convention, as it does not have the Service suffix. There are two ways to integrate the Qodana plugin into Qodana:
- Publish it on JetBrains Marketplace
- For quicker turnaround, put the plugin’s JAR artifact into your project’s
.qodanadirectory.
To simplify the build, copy the build/distributions/qodana-code-inspection-0.0.1.zip file from the plugin project to the .qodana/qodana-code-inspection-0.0.1.zip file in the playground project. Create the .qodana directory, if it does not yet exist. Then extract the archive with your preferred program or tool. Qodana is able to access the plugin in the build/distributions/qodana-code-inspection directory.
In addition, Qodana needs to be configured to include our custom code inspection. Change the qodana.yaml file in the root directory of the playground project as follows:
version: "1.0"
linter: qodana-jvm-community
include:
  - name: org.intellij.sdk.codeInspection.ServicePackageClassNameInspection
The include block needs to refer to the fully qualified class name of the code inspection available in the plugin. Now execute the following command to run Qodana from the terminal:
qodana scan --volume $PWD/.qodana/qodana-code-inspection:/opt/idea/custom-plugins/qodana-code-inspection
This will download the corresponding Qodana Docker image. A Docker container will be created and run based on the Qodana configuration. To make the custom plugin accessible inside the Qodana run, mount the Qodana plugin directory from the local filesystem to the appropriate directory inside the Qodana Docker container. After a couple of minutes, Qodana will produce a report summary and print it to the standard output.
Qodana - Detailed summary
Analysis results: 1 problem detected
By severity: High - 1
-------------------------------------------------------
Name                           Severity  Problems count
-------------------------------------------------------
SDK: Discouraged class name    High      1
-------------------------------------------------------
Open the full report in your browser:
  Do you want to open the latest report [Y/n]Yes

!  Press Ctrl+C to stop serving the report

\  Showing Qodana report from http://localhost:8080/... (10s)
Qodana will show that SomeComponent does not conform to the code convention provided by our local inspection in the Qodana plugin.
Tips for future runs
When the Qodana plugin is modified and rebuilt, the Qodana cache needs to be recreated as well. In such cases, use the --clear-cache CLI switch to reload all of the Qodana run’s dependencies.
qodana scan --clear-cache --volume $PWD/.qodana/qodana-code-inspection-0.0.1.jar:/opt/idea/custom-plugins/codeinspection.jar
Plugging Qodana into your IDE
The Qodana plugin can be installed from disk into the IDE. Its code inspection is then automatically enabled and invoked for any Kotlin class in a project. To check that it’s working, revisit the playground project, open the org.intellij.sdk.qodana.service.SomeComponent class, and make sure that the problematic class name is underlined. As a convenience, hovering the mouse on the class name will show the code inspection result along with the problem description. Alternatively, you can open the Problems tool window and find the problem in the list of all problems reported by code inspections.
The code inspection now behaves like any other inspection provided by the IDE. In Settings | Editor | Inspections | Kotlin, you’ll find the SDK: Discouraged class name inspection, along with the description sourced from the HTML file that we provided before.
Running Qodana within the IDE
With the plugin installed, you can now run Qodana from your IDE as well. In the Problems tool window, go to the Qodana tab, and click the Try Locally button. Qodana will be configured with the qodana.yaml file and run. The Qodana report can be found directly in the tool window.
Qodana plugins and JetBrains Marketplace
Properly built and tested custom inspection plugins can be published on JetBrains Marketplace, removing the need to serve them from the .qodana directory. Instead, you just need to make sure that the Qodana configuration specifies a public plugin identifier that matches the id element in the plugin descriptor.
version: "1.0"
linter: qodana-jvm-community
plugins:
  - id: com.github.novotnyr.qodanacodeinspection
Qodana’s scan command is simplified, as the .qodana directory mount is no longer necessary.
qodana scan
Qodana downloads this plugin from JetBrains Marketplace and runs all its inspections, producing both console output and an HTML report that can be shown in a web browser.
Summary
We have created a Qodana plugin with a code inspection that checks for a specific code convention, and we have a handful of ways to run it:
- As a JAR placed in the
.qodanadirectory and included in the Qodana YAML file. - As a reference to the publicly available plugin on JetBrains Marketplace.
- As a JAR installed in the IDE, where the inspection is applied in a local Qodana run.
- As a JAR installed in the IDE, where the inspection is included among the integrated code inspections.
See the IntelliJ SDK Code sample for concise examples of both the Qodana plugin and a playground project