Scala Plugin
Scala Plugin for IntelliJ IDEA and Android Studio
Incremental Highlighting for Scala

If an error is detected in a file but no one sees it, is it really highlighted?
This is a tale about why highlighting only what’s visible is both the strangest and the most reasonable thing to do – and how you can benefit from it.
(Enable Settings | Scala | Editor | Highlighting Mode | Incremental to speed up highlighting and reduce resource consumption.)
Compiling highlights
Both IDEs and compilers analyze code, but they do so differently. Compilers, for example:
- Translate source code into executable code.
- Process every source file.
- Treat errors as obstacles to the main goal.
Incremental “compilers” can prevent recompilation, but they also eventually compile everything.
IDEs, on the other hand:
- Analyze code for the purpose of understanding and editing.
- Highlight errors in the context of the current task.
- Process only what’s necessary and can tolerate errors.
If one source file doesn’t compile, the compiler won’t process another file that depends on it. An IDE, however, can highlight code that depends on a file with errors, and there might be no errors in the highlighted code itself.
So far, so good. However, even though IDE algorithms do not depend on files, the user interface does. Just as you run scalac Foo.scala, you open Foo.scala in an editor tab. The IDE processes the entire file, even if it’s very large and most of it is not visible or relevant to the task at hand. Because of this, highlighting depends on where you place classes and methods. If you put class Foo and class Bar in separate files, Foo is not highlighted when you edit Bar; but if both classes are in the same file, viewing or editing one class also highlights the other.
For compilers, a UI that processes files in their entirety is natural, because that’s how they work. IDEs, however, do not have this limitation. In contrast to a compiler, IntelliJ IDEA can re-highlight only part of a file without recomputing everything. Nevertheless, there is still an initial highlighting, and not every modification can be localized. The IDE keeps the entire file highlighted, similar to how a compiler keeps the entire project compiled – but it doesn’t have to. What if we could do better?
The file is a lie
Consider the following:
Looks like a code snippet, huh? But no, it’s a “file”:
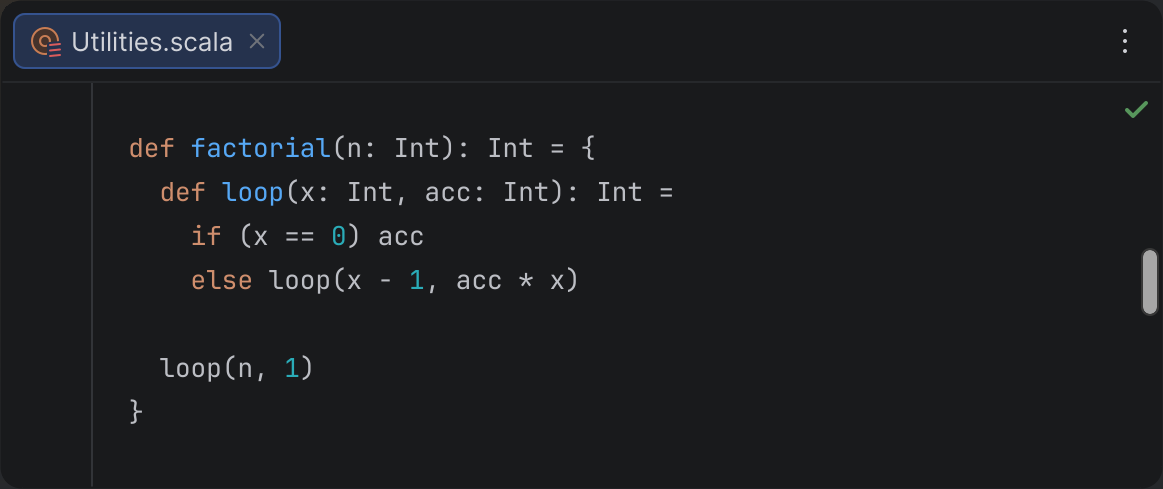
We take this UI pattern for granted. However, if you think about it, such a “file” is no different from a “file” in the Project view: the title shows the name, just like nodes do; the scrollbar provides navigation, like the tree does; the error stripe can show marks, and the tree can show marks as well. We don’t really see the entire file, only a code snippet.
Thus, the question of whether to highlight the entire file makes no sense – we cannot highlight elements that are not visible, just as we cannot highlight elements in files that are not open. (And “opening a directory” in the Project view doesn’t change that.) Note that we don’t say that compilers “highlight” files; only IDEs do. We can only highlight what’s visible. Beyond that, analysis is involved, but not highlighting.
What you see is what you get
Now, how much should an IDE analyze? Even though it’s not possible to highlight code beyond the visible area, it is possible to draw marks on the error stripe, underline nodes in the Project view, or display errors in the Problems tool window. IntelliJ IDEA does all this. Yet, it doesn’t analyze code in files that are not open. Why? Isn’t more analysis better? (In principle, IDEs could process every single file, just as compilers do.) First, there are diminishing returns. Second, it is not without cost.
Source code is not a collection of random symbols. Code has high cohesion and low coupling. The greater the distance between two points in code, the less interconnected they are. That’s why highlighting code in the immediate context is more important, while highlighting distant code is less important. Moreover, the latter can only distract from the task at hand. If you’re editing a method, you don’t want to be distracted by thousands of errors in other files while you’re still in the process of editing.
At the same time, analysis consumes CPU, RAM, and battery. It can make the IDE or even the entire OS less responsive. In this highlighting economy, you want to maximize profit by balancing revenue and costs. But what is the proper scope to hit this Goldilocks zone, and is “the file” the answer?
To begin with, “file” is not a language entity (and compilation units don’t have to be files). It’s actually an implementation detail of how we store source code. In principle, we could store code as an abstract syntax tree (AST) in a database; then there would be no files. Metrics such as cyclomatic complexity are about packages, classes, and methods – not files. It could be that the distance in code is more important than the file boundary.
Another issue with files is that they can be arbitrarily large. In principle, you could put all project classes into a single file. This would not affect the bytecode, but it would make source code more costly to highlight. (Although there is some benefit to detecting errors in the entire file, this doesn’t guarantee the absence of errors in general – for that, you need to compile the project anyway.)
Now consider the visible area: that’s where we can actually highlight code. It is the focal point of attention and the location of the cursor, where feedback is immediate rather than indirect. The benefits of analyzing code in the visible area are the greatest. At the same time, the visible area is naturally bounded by display resolution, human vision, and human comprehension, and the cost of analysis does not depend on file size. It could be that “visible area” is a better choice for the scope than “file.” (We can also extend this logic to folding and skip parts that are folded and not actually visible.)
???
Fortunately, this is not just a theory – you can already try it in practice! Incremental highlighting can now be enabled in Settings | Scala | Editor | Highlighting Mode:
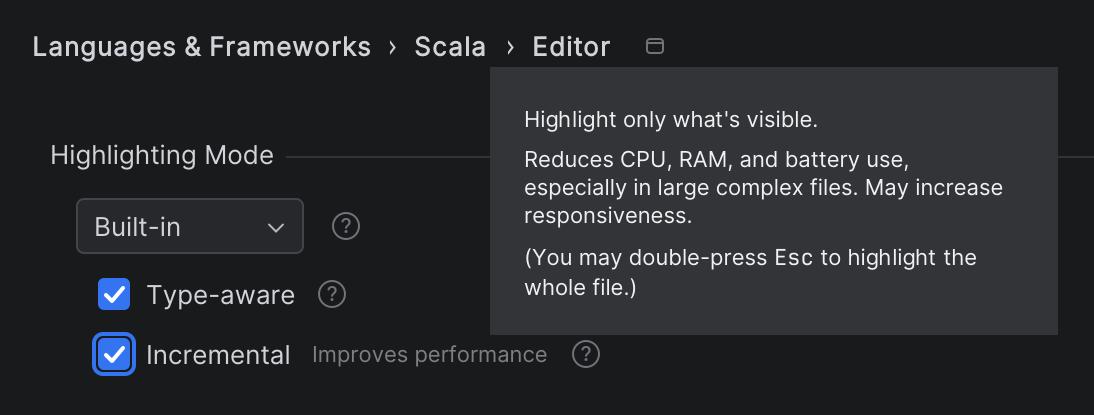
The setting is only for Scala and is available only when you’re using the built-in highlighting, not the compiler. The setting is per-project, so if you want to use this mode in multiple projects, you need to enable it in each one. (The capability has actually been available since 2024.3, but we recommend using the newest version to benefit from more improvements.)
When incremental highlighting is enabled, only code in the visible area is highlighted (excluding folded parts). The algorithm can handle multiple editors, including split editors and the diff viewer.
The mode is called “incremental” rather than “partial” because, even though only part of a file is highlighted, the parts that have already been highlighted remain highlighted. If you scroll through the code back and forth, computations are cached and not duplicated. Furthermore, the mode works well with incremental updates on modifications; editing code in a local scope preserves the already highlighted ranges, even outside the visible area.
To make scrolling smoother, the algorithm pre-highlights 15 lines before and after the visible area. (It’s possible to customize this range by adjusting scala.incremental.highlighting.lookaround in the registry.) However, if you navigate to a definition in a file directly, you may observe on-the-fly highlighting, similar to when you open a file for the first time or navigate to definitions in other files.
The error stripe (marks on the scrollbar) is filtered to include only data within the visible range. Next/Previous Highlighted Error navigates between known – usually visible – errors. Several inspections, such as Unused Declaration and Unused Import, are not active. However, imports are normally folded anyway, and Optimize Imports does work. Many of these restrictions are accidental, intended to keep the implementation simple, and can be improved in future updates. (Select Nightly in Settings | Languages | Scala | Updates to get updates faster.)
When the incremental highlighting mode is enabled, you can double-press the Esc key to analyze the entire file on demand, using all inspections.
Profit
The benefits of using incremental highlighting include:
- Better responsiveness
- Optimized CPU usage
- Efficient memory usage
- Cooler system temperatures
- Quieter operation
- Longer battery life
This applies to both initial highlighting and re-highlighting – both when viewing and editing code. In many cases, highlighting time can be reduced by up to 5–10 times, though the exact amount depends on the file size and code complexity. The benefits of incremental highlighting are especially noticeable for Scala code, which can be rather complex and difficult to analyze.
The benefits also depend on hardware; if you have a powerful desktop machine with water cooling, the effect might be less noticeable, but if you use an ultrabook, the difference is more significant.
Feedback welcome
Both the idea and the implementation are works in progress. Many parts can be refined and improved further. (See SCL-23216 for more technical details.)
We’d love for you to try the feature and share your feedback. Please report any issues through YouTrack. If you have any questions, feel free to ask us on Discord.
Happy developing!
The Scala team at JetBrains