Qodana
The code quality platform for teams
Qodana Lints Your Code. What’s Checking Your DevOps and Platform Engineering Stack?


A developer in DevOps pushes a Kubernetes deployment with no resource limits, a pod running as root explicitly, and a GitHub Actions workflow runs with mutable tags – and it goes straight to production, unnoticed. No quality gate. No IDE warning. No CI failure. An innocuous change, silently shipped, but with high consequences.
Qodana lints your application code. It catches unused variables, security vulnerabilities, code style violations, and architectural issues before they reach production. Quality gates drive the build. The IDE flags problems inline. Developers get fast feedback on every commit.

Who’s checking your DevOps and platform engineering stack?
Most DevOps/platform engineering teams rely on a collection of disconnected CLI tools to analyse infrastructure:
- Kube-score: Kubernetes manifest analysis;
- Checkov: Terraform and CloudFormation;
- Hadolint: Dockerfile linting;
- Ansible-lint: Ansible playbooks and roles;
- Tfsec/Tflint: Terraform security and best practices;
- Trivy: container image and IaC scanning;
- Conftest: policy-as-code with OPA;
- Yamllint: generic YAML validation;
- Actionlint: GitHub Actions workflow linting.
Each has its own configuration syntax, its own severity model, its own CI integration, and its own maintenance story. There is no shared quality gate. There is no IDE feedback loop. And there is no cross-domain analysis – a Terraform module that provisions a public S3 bucket and the Helm chart that references it cannot be evaluated together.
The result: infrastructure code gets merged with a fraction of the scrutiny applied to application code. Security misconfigurations, reliability gaps, and operational risks ship quietly.
What if Qodana extended to DevOps artifacts?
Here is what findings could look like across the five domains that matter most:
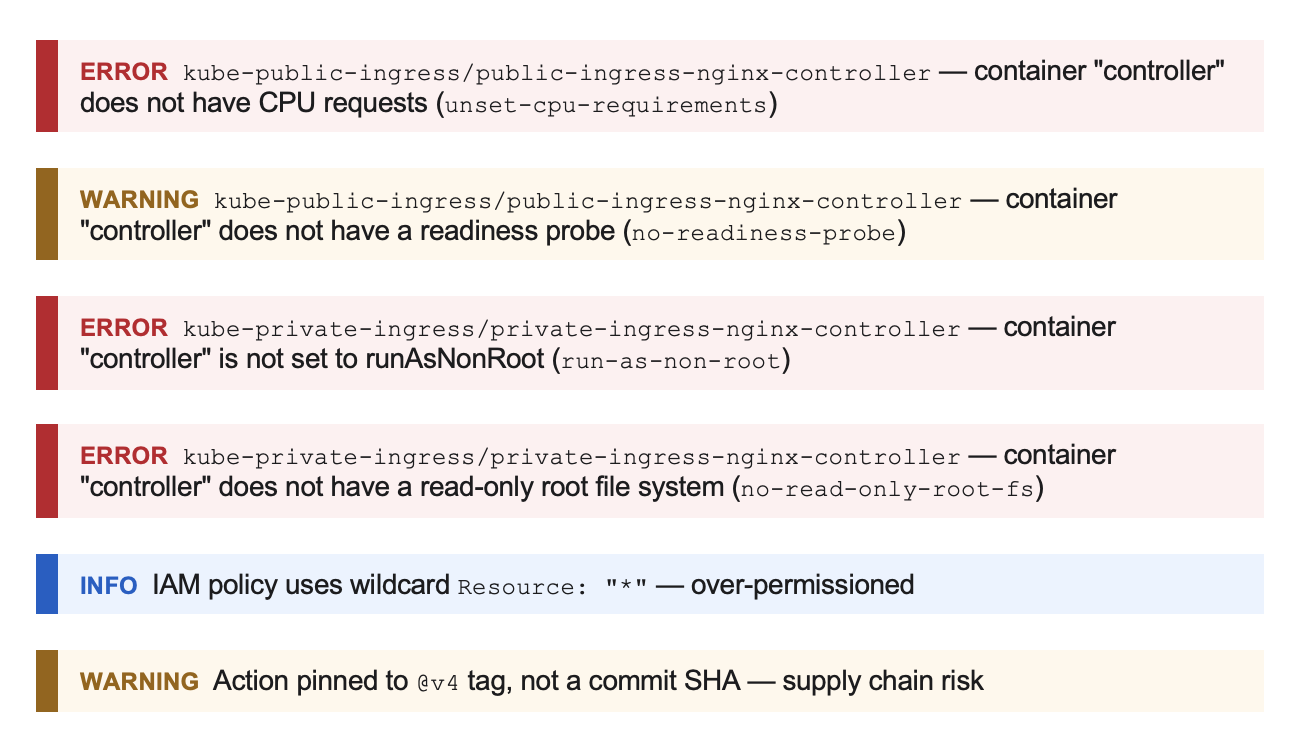
The analysis could be extensible: community-built adapters for tools like Pulumi, CDK, or GitLab CI could plug in directly via qodana.yaml.
Look and feel
A Qodana DevOps Linter would surface findings in the same user interface teams already use for application code – same report structure, same severity model, same quality gate.
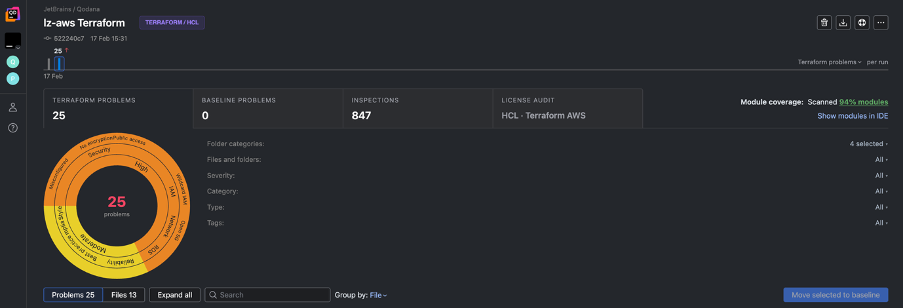
Using Qodana fits the DevOps philosophy because it would close the loop between who writes software and who runs it in production.
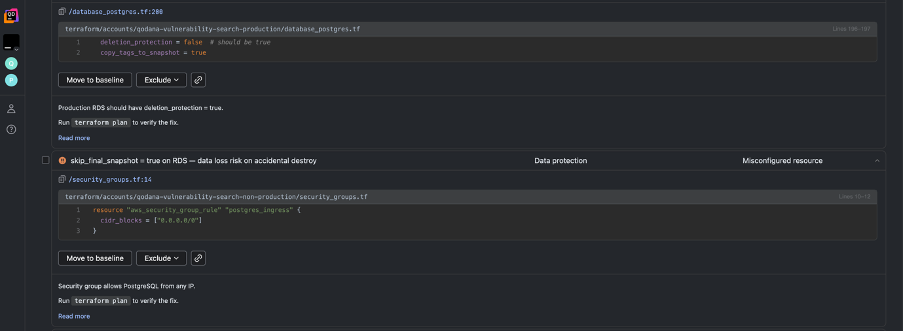
The overview report would give an immediate picture of the infrastructure quality posture – total problems, inspections run, and a breakdown by severity and category across all five domains.
Why this matters beyond the linter itself
The deeper value isn’t catching individual misconfigurations. It’s establishing a shared quality standard for infrastructure code, the same way Qodana established one for application code.
That means:
- The same developer experience: IDE feedback, CI enforcement, quality gates;
- The same configuration model: one qodana.yaml covers both application code and DevOps artifacts;
- Cross-domain analysis: rules that span a Terraform module and the Helm
chart it backs; - A shift-left posture for the entire stack: not just the application layer.
Is this a problem you recognize?
This is still an idea in early exploration. We are looking forward to learning if other practitioners see the same gap.
Does this match a pain point in your team? Is there a domain or tool you would want analysed first? Get in touch and let’s discuss your thoughts.