Debugging in CLion 2020.3: Set Execution Point
CLion comes with powerful debugger integration, giving you access to backend debuggers such as GDB and LLDB via a uniform UI. The IDE helps you debug efficiently with its built-in variables view, a variety of stepping and breakpoints options, evaluation of expressions, and memory and assembler views.
With CLion 2020.3 EAP, we’ve added a new powerful option to control the execution flow during debugging – Set Execution Point.
You might be aware of this feature if you’ve ever used Set Next Statement in Visual Studio or Jump to Line in IntelliJ IDEA. In brief, it allows you to move the execution during debugging to an arbitrary line of code in the editor.
Set Execution Point
To move around the code when debugging, the following actions were previously available:
- Step Over (F8) and Step Out (Shift+F8)
- Step Into (F7) and Smart Step Into (Shift+F7)
- Run to Cursor (Alt+F9)
- Force Step Into, Force Run to Cursor, and Force Step Over
We’ve now added a new action – Set Execution Point to Cursor. It becomes available after you start a debugging session, and it allows you to jump to a particular line and set the execution point there, skipping all other commands in between.
There is no default shortcut for the action yet, but you can assign it in the keymap settings. Or you can simply drag and drop the orange arrow from the gutter, inserting the execution point on the desired line. The highlighting will help you select the right execution line you need as you’re dragging the arrow:
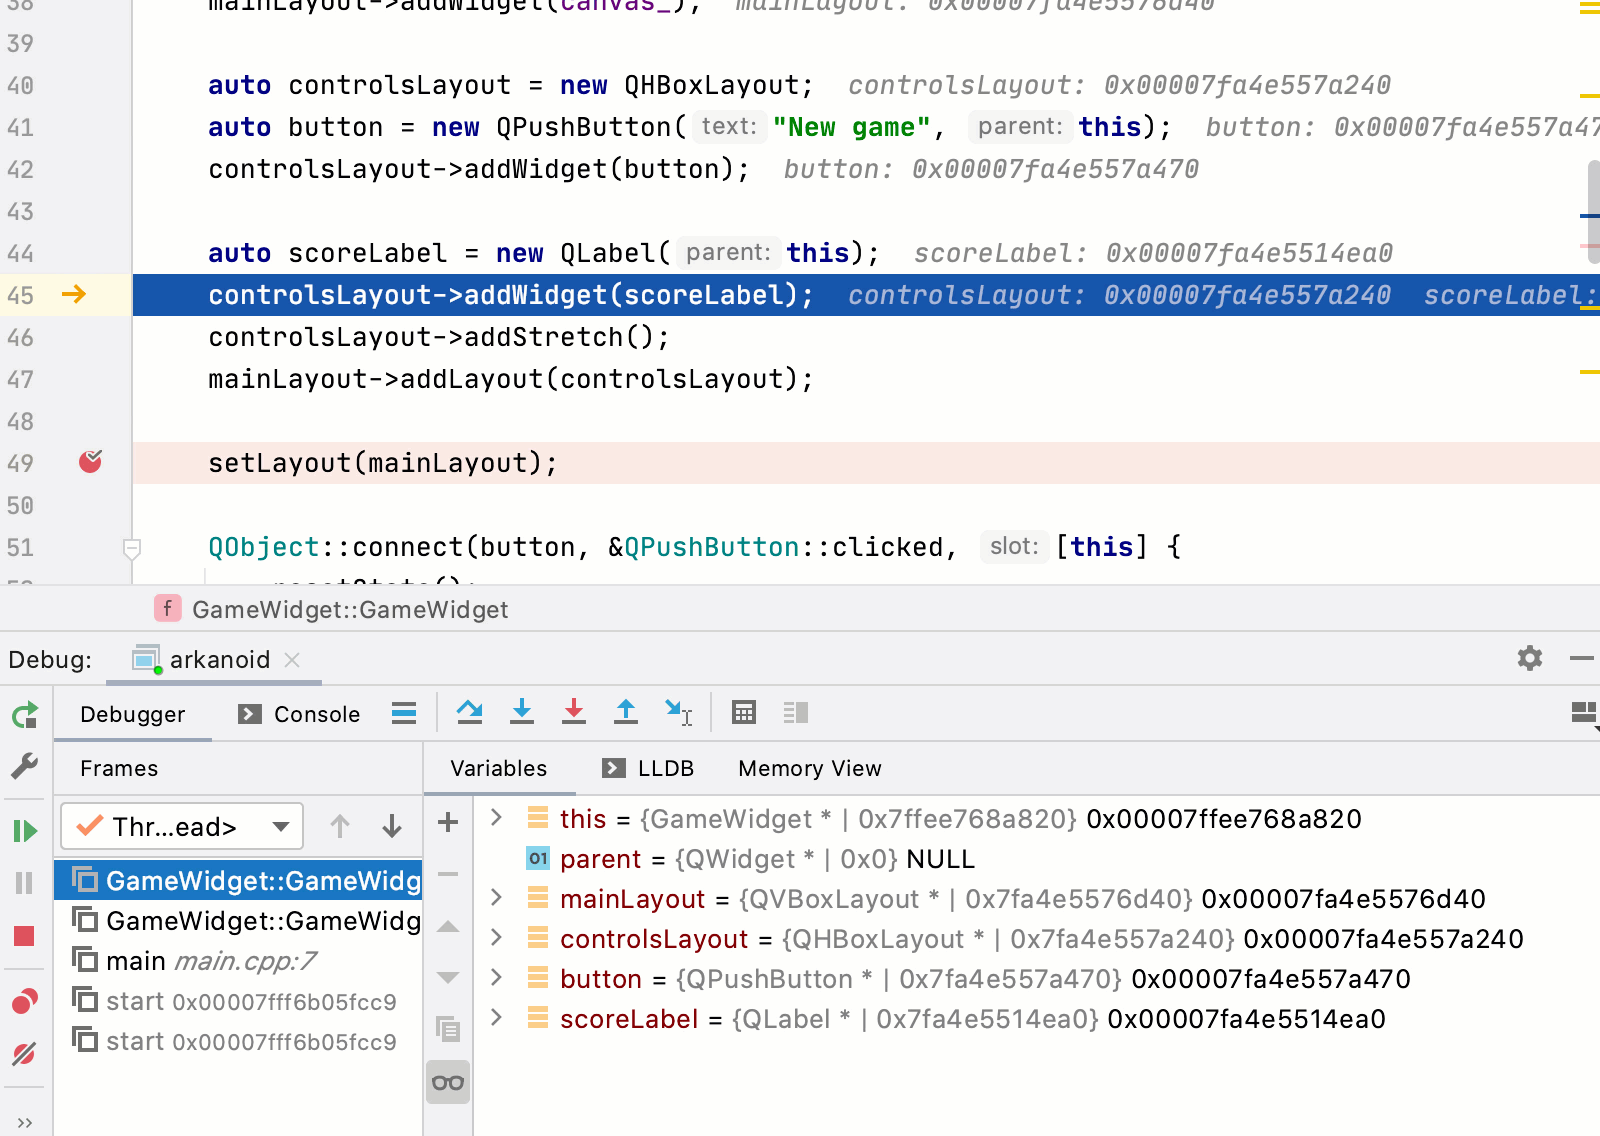
Note that you can move the arrow either forward or backward!
Interrupting the control flow
Moving back and forth is easy when the execution graph is linear. But what if the control flow graph is more complicated? With the Set Execution Point action you can:
- Break loops or restart them.
- Skip loops completely, including endless loops (code from the loop body won’t be executed in this case).
-
Select another branch in the
if-elseclause orswitch-casestatement.
For example, this may be useful if you want to check another branch during the debug session without restarting the whole session:
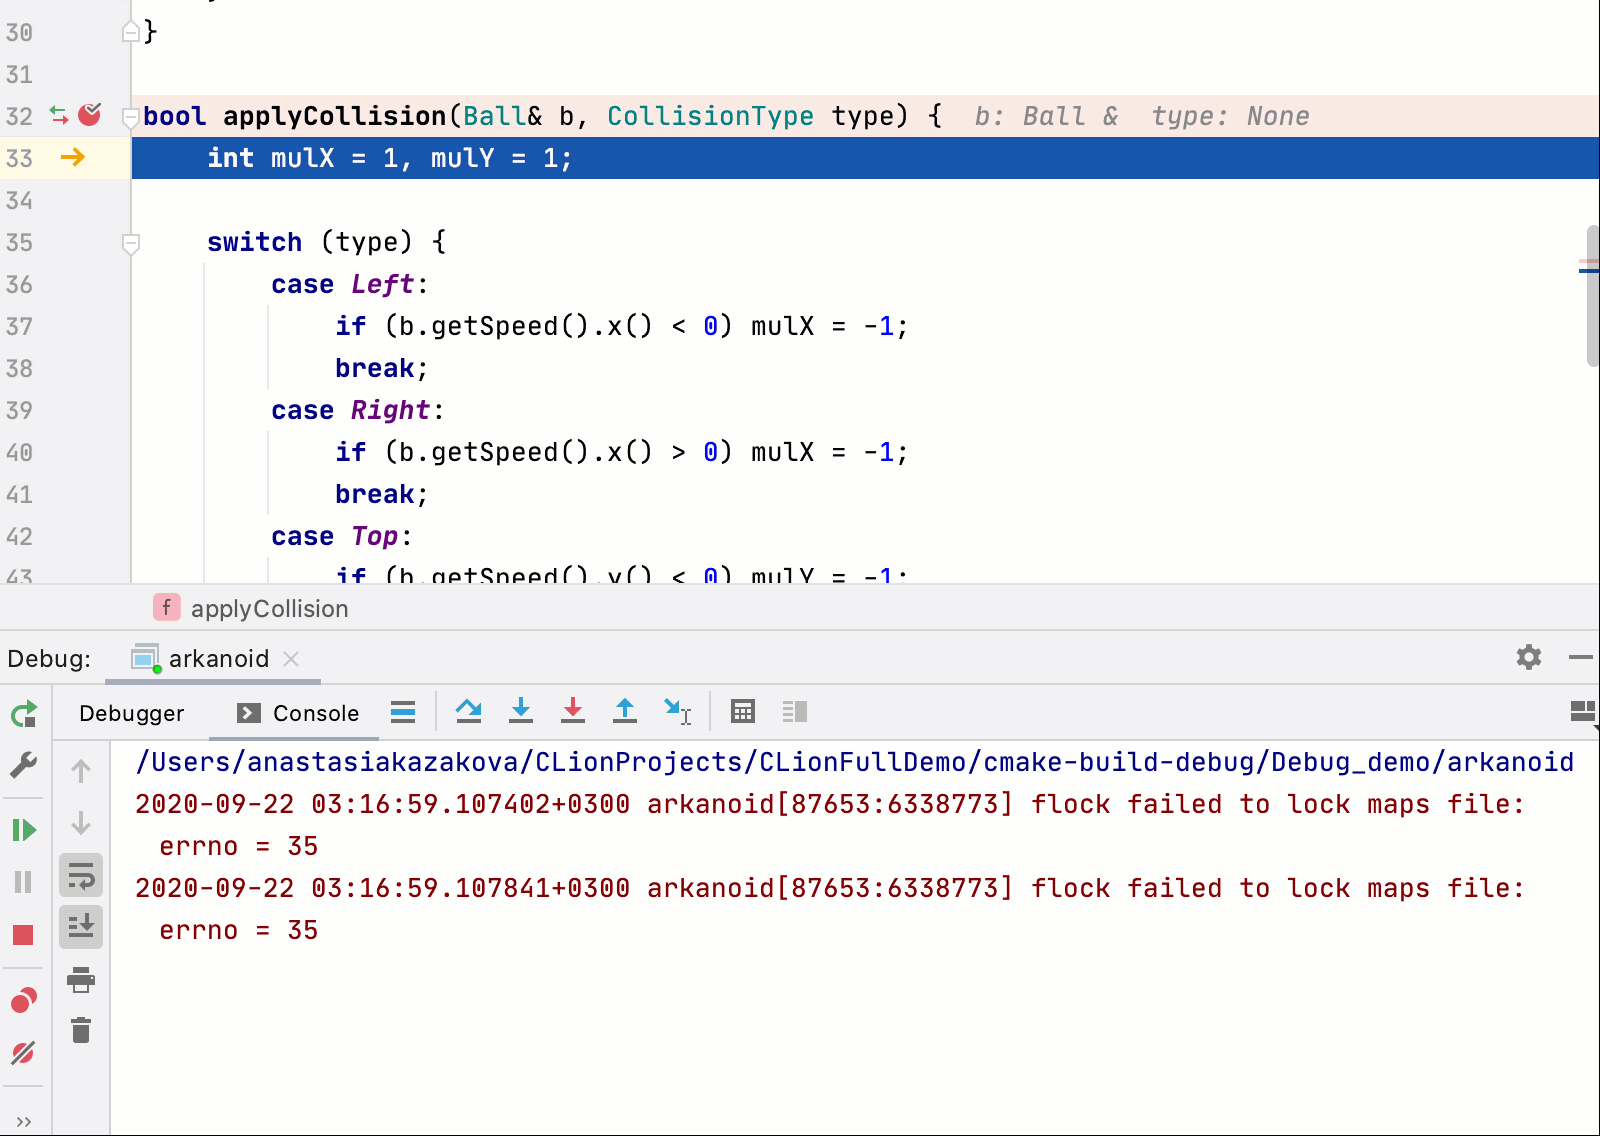
Note, however, there could be some negative consequences for the program execution when moving the execution point:
- If you jump over the line at which a variable is initialized, you’ll get the value from the stack/register (which is likely not the value you expect there to be).
- If the executable code was optimized by the compiler, you might get an unpredictable result or be unable to move the execution point at all.
- If you jump to another function that is not called in the current control flow graph, the IDE will warn you that the execution might be broken (works for LLDB, and in development for GDB now).
-
There are also known issues like the “multiple candidates exist” error (CPP-21800) and problems with
std::cinandstd::cout(CPP-22055).
Isn’t this feature cool? Try it for yourself and please share your feedback and thoughts here in the comments or in the parent ticket in YouTrack: CPP-9661.
Your CLion team
JetBrains
The Drive to Develop

