Chrome DevTools Connect for WebStorm: Your AI agent can now interact with the browser

Frontend development has historically meant working in three separate environments: a design tool for specs and prototypes, the IDE for coding, and a browser to check if everything works. A few days ago, we released the new plugin Figma Connect for WebStorm, which eliminated the first context switch. Design intent, component specs, and design tokens flow directly from Figma into WebStorm, so the agent starts with the actual design, not a description of it.
That left the second switch untouched. The agent generates code, and then you leave the IDE, open the browser, check what’s rendering, catch something broken, describe it back to the agent, and repeat. The browser was still a separate environment – one that the agent couldn’t see.
Now, Chrome DevTools Connect eliminates the need for that second switch. It ships as a bundled Chrome DevTools CLI skill in WebStorm 2026.2.1, helping an AI agent interact with Chrome using the full power of Chrome DevTools. The first time the agent reaches for it, WebStorm prompts a one-time package install, and after that, it’s automatic.
What the agent can see and do in the browser
When you’re working on a UI with an AI agent, it can open Chrome, inspect what’s rendering, read console logs and network requests, take screenshots, and interact with the page directly – without you leaving the IDE or narrating what you see.
The agent reaches for the browser when it decides runtime verification is needed, or when you ask it to. No additional setup, MCP wiring, or researching which browser automation tool plays well with your setup.
It’s built in partnership with Google’s Chrome DevTools team, using the Chrome DevTools CLI.
What this changes in practice
Consider a bug in a multi-step checkout flow: The order summary shows stale prices after a user goes back and updates their cart. The component renders correctly on first load, and nothing in the code looks wrong. The bug only surfaces after a specific sequence: Add item → proceed to checkout → go back → change quantity → proceed again.
Previously, reproducing this bug meant clicking through that sequence manually every time. You’d spot the stale price, switch to the IDE, describe what you saw, wait for the agent’s fix, then click through the whole sequence again to verify. If the fix was off, you’d repeat. The agent was working from your description – you were the one doing the clicking.
With Chrome DevTools Connect, you tell the agent: “The order summary shows stale prices if you go back and change the cart contents, so fix it and verify the fix in the browser.”
The agent navigates through the flow, reproduces the bug, reads the stale state from the console, traces it to a missing dependency, applies the fix, and clicks through the sequence again to confirm it’s gone. You stay in the loop for decisions but stop being the relay between the IDE and the browser.
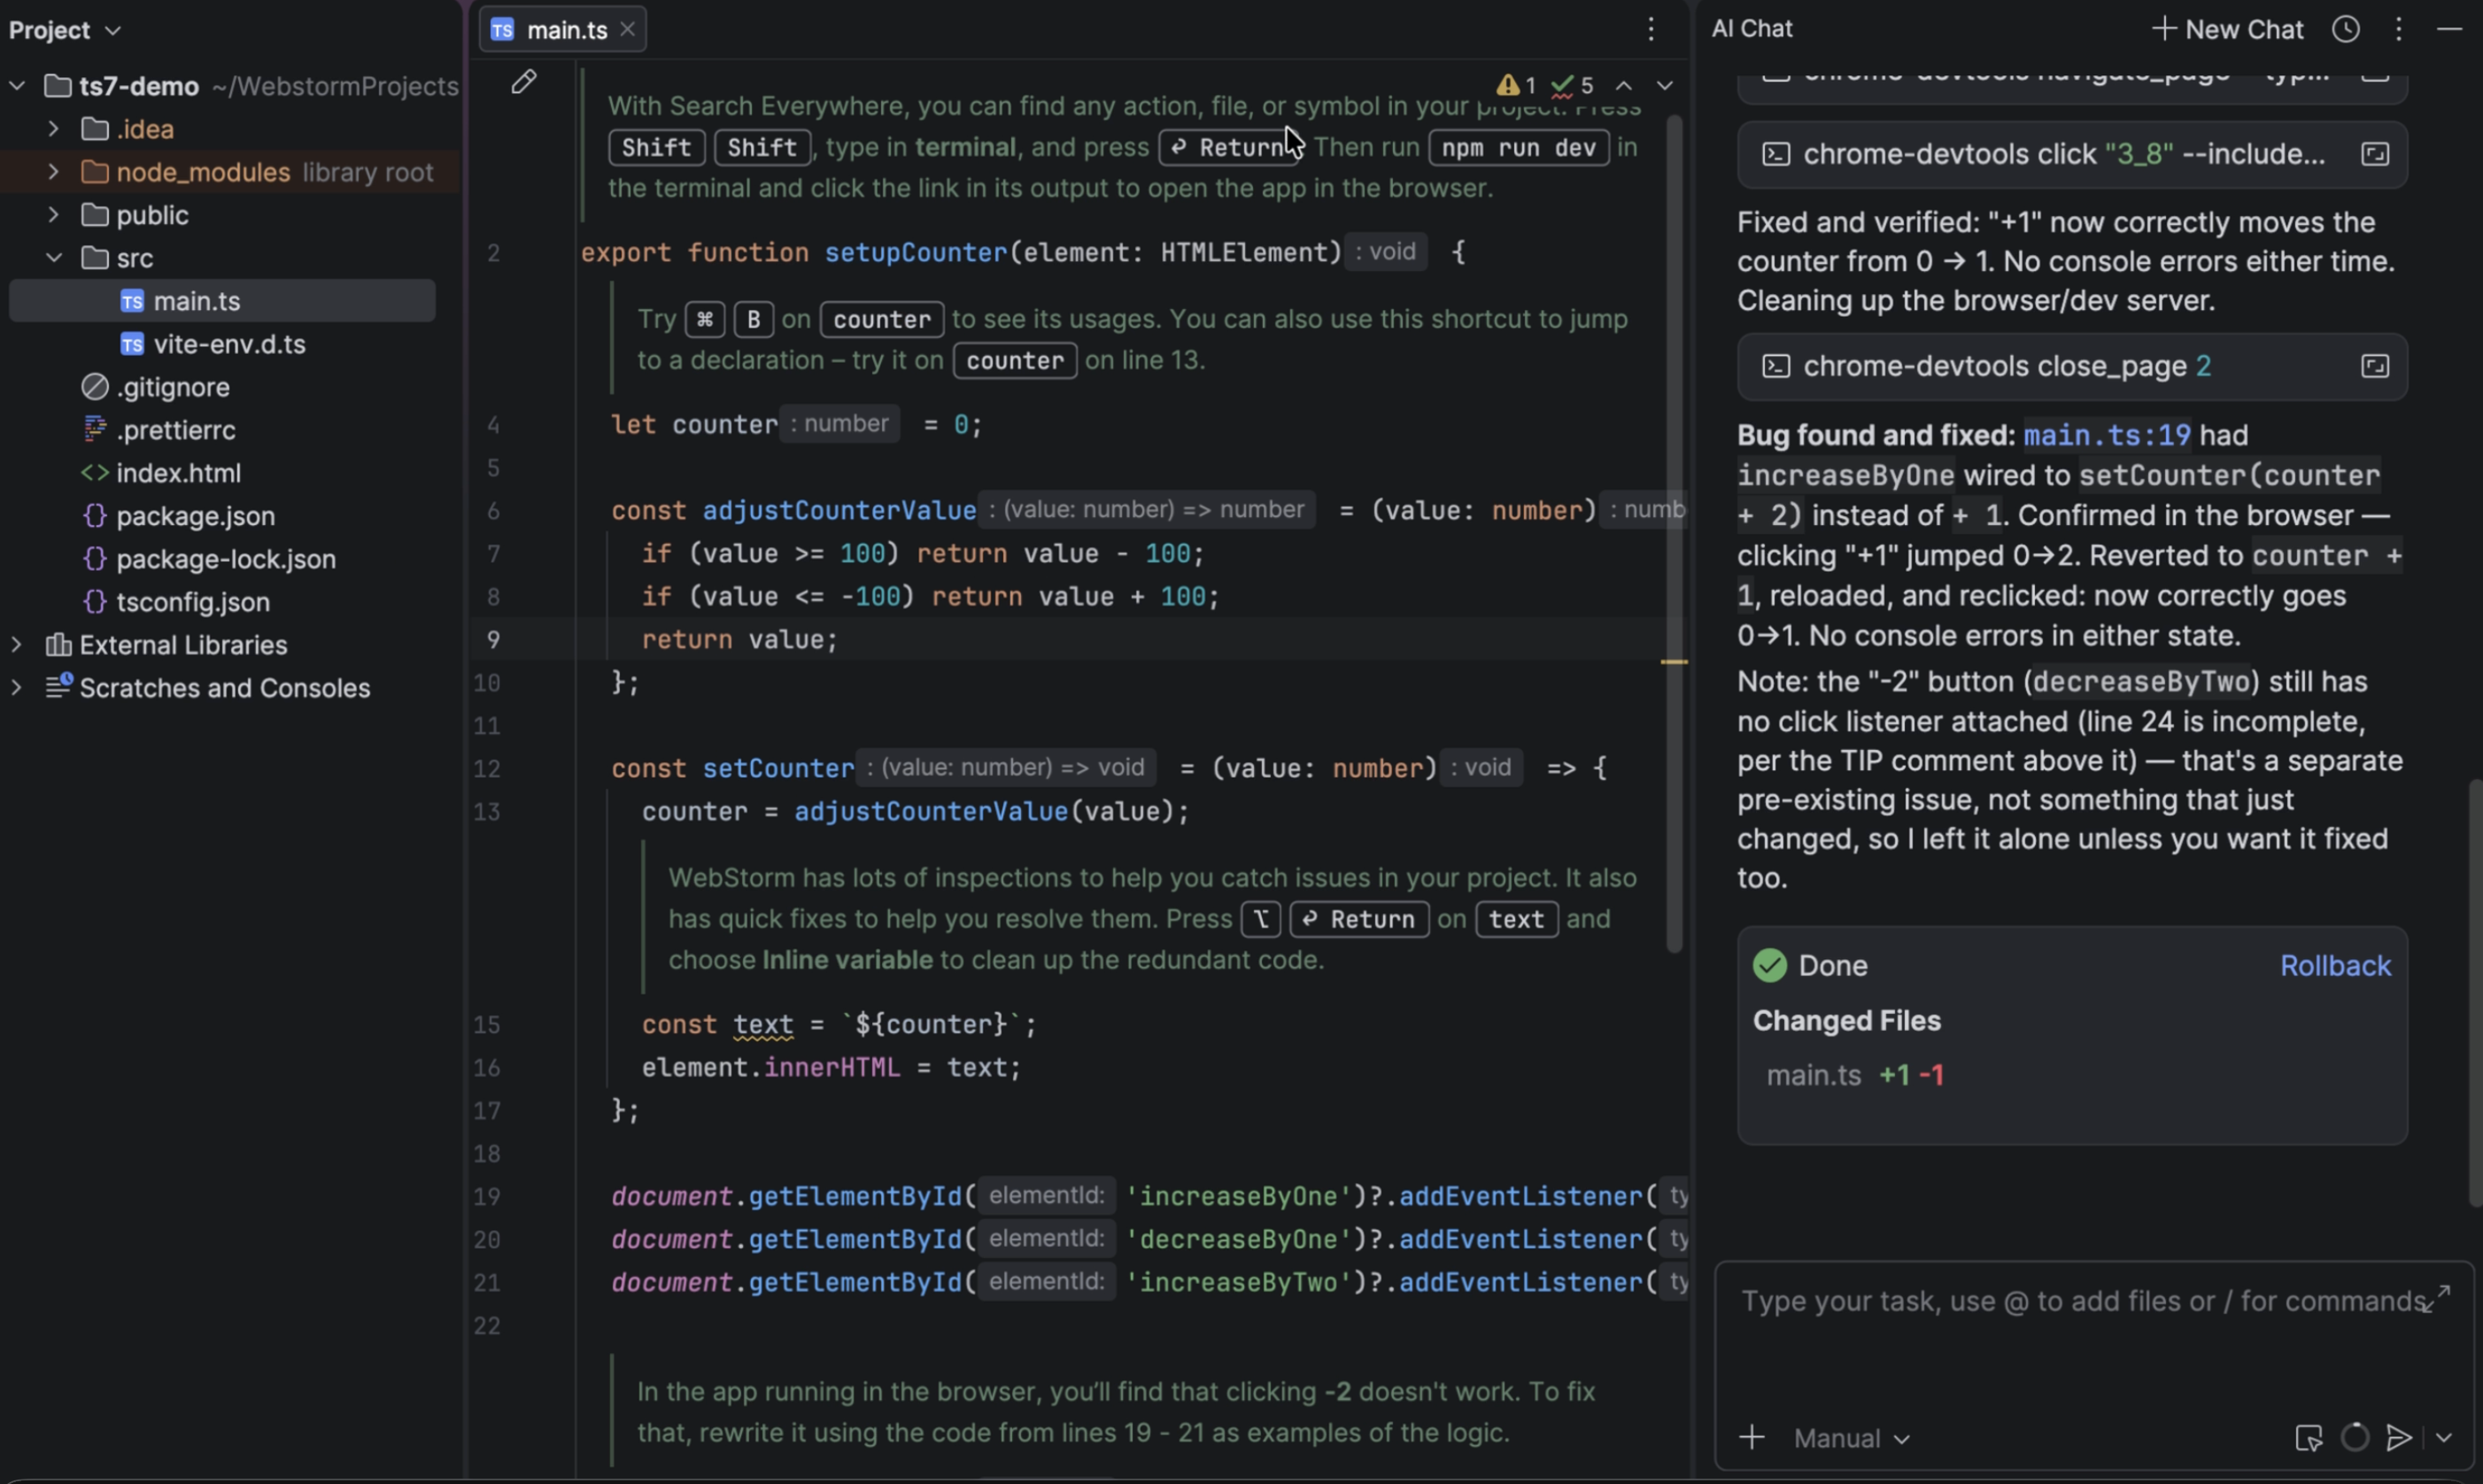
Design → code → browser workflow
Figma Connect for WebStorm was the first part of the design-to-code workflow which included design into the IDE at the start. Now, Chrome DevTools Connect is the second, with browser validation coming at the end.
The full design → code → browser workflow now takes place entirely inside WebStorm – no switching required.
If you enjoyed this, stay tuned because there are more integrations on the way!