Datalore: 5 Techniques for Insightful Analytics With SQL
Greetings from the DataGrip and Datalore teams!
You may have already been using DataGrip for a while, and perhaps you’ve mastered SQL and databases. But what if your data insights could reach a wider audience and help you drive your company’s growth?
Nowadays there is huge demand for insightful analytics, and people who can tell comprehensive data stories are extremely valued on the market.
Read this blog post to learn about 5 modern techniques you can use to upgrade your SQL analytics skills!
1. Combine SQL with Python in one interface
SQL is extremely good for data retrieval and calculating basic statistics, whereas Python comes into its own when you need in-depth, flexible exploratory data analysis. What if you could use both programming languages inside one tool?
At JetBrains, we have combined the power of DataGrip’s SQL engine with the interactive features of Datalore and introduced native SQL support inside Python notebooks.
Now you can add SQL cells right inside Datalore’s editor and query data from an SQL datasource. The query result is automatically transferred to a pandas DataFrame and you can continue seamlessly working on the dataset in Python.
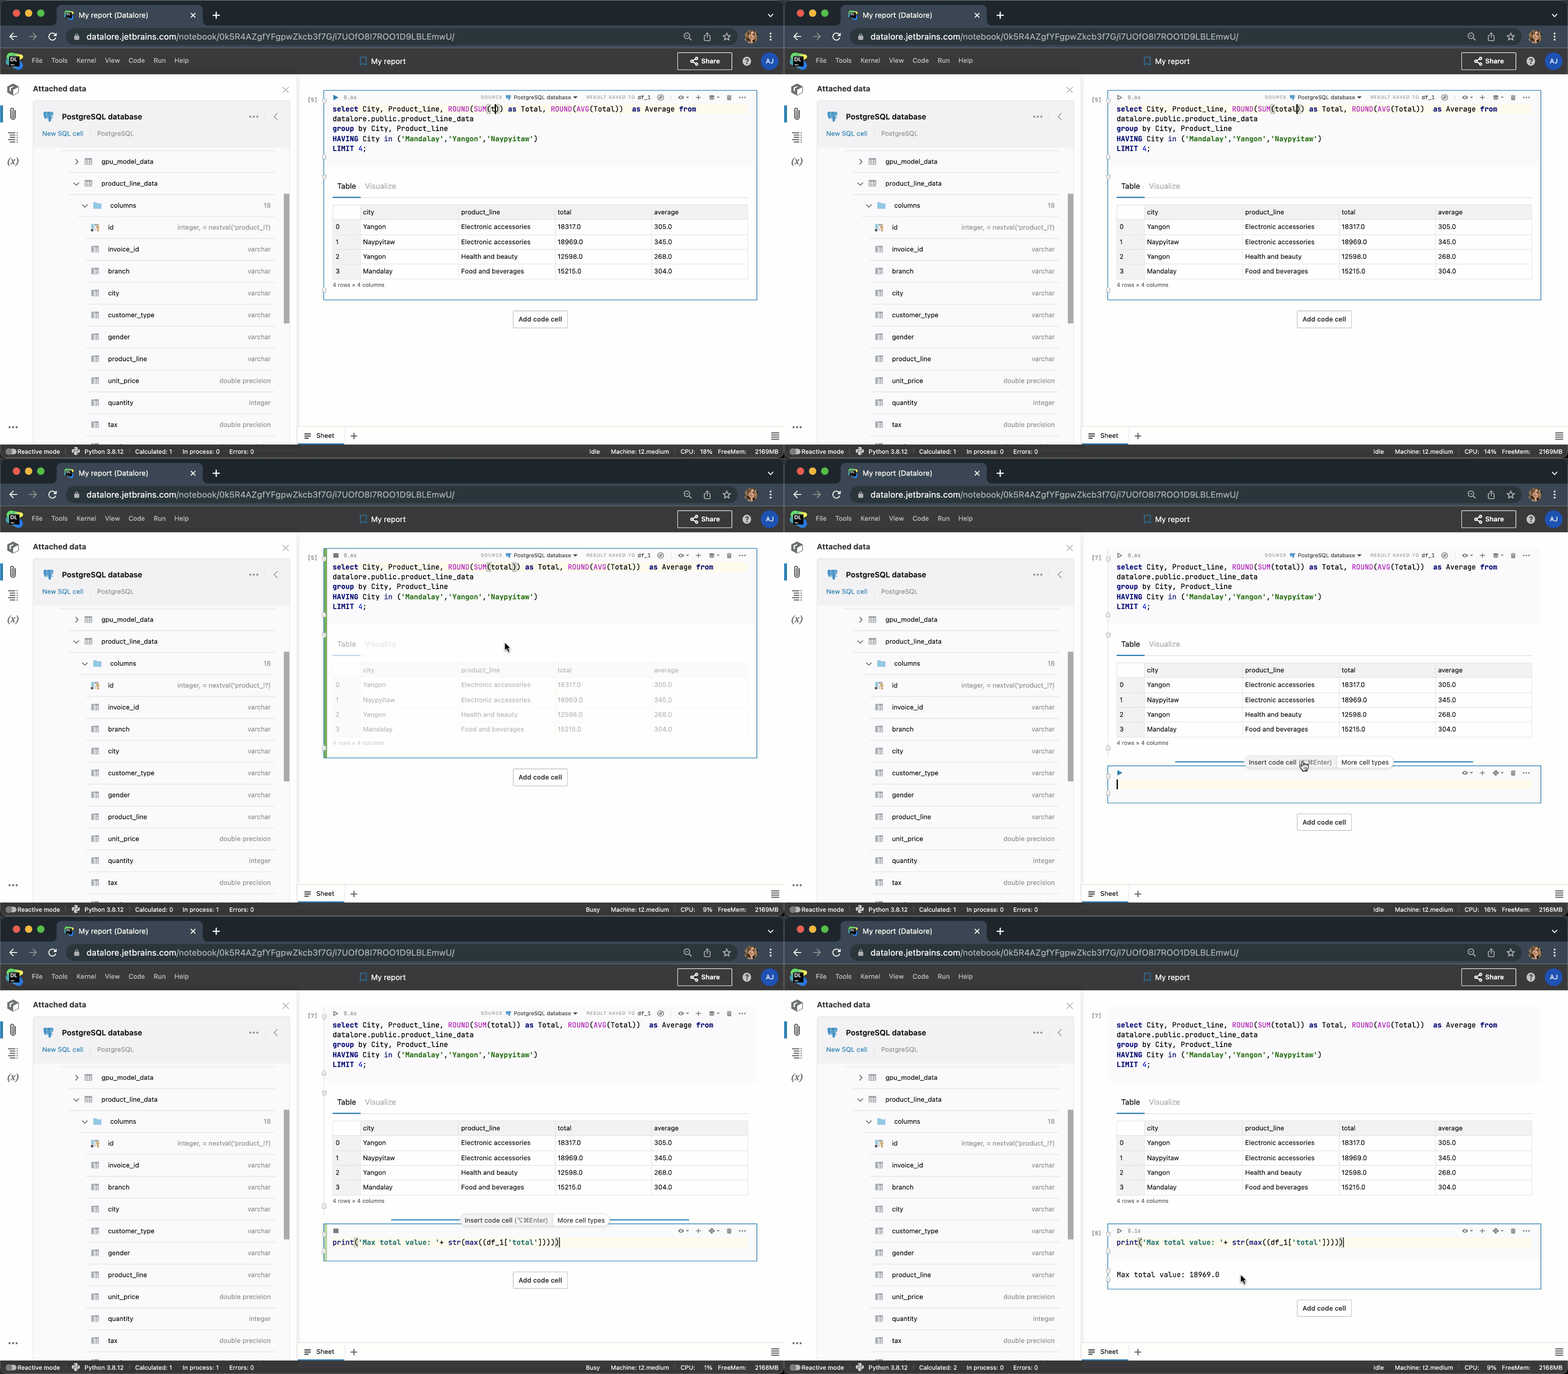
Python has dozens of packages for data analytics. If you are just starting out, we recommend you start by learning pandas for table data analytics and Plotly for beautiful interactive visualizations.
Datalore Community users get a 30-day free trial for SQL cells. For Professional and Enterprise users the feature is unlimited.
2. Describe query results with Markdown
Have you ever come back to an SQL script you wrote some time ago and thought “what the heck was I trying to do here?”.
Notebooks in Datalore act like google docs for your code. You can execute SQL queries and document your code and outputs nicely with text, images, and Markdown. Just add a new Markdown cell, create a structure with headings, and navigate through the notebook using a table of contents.
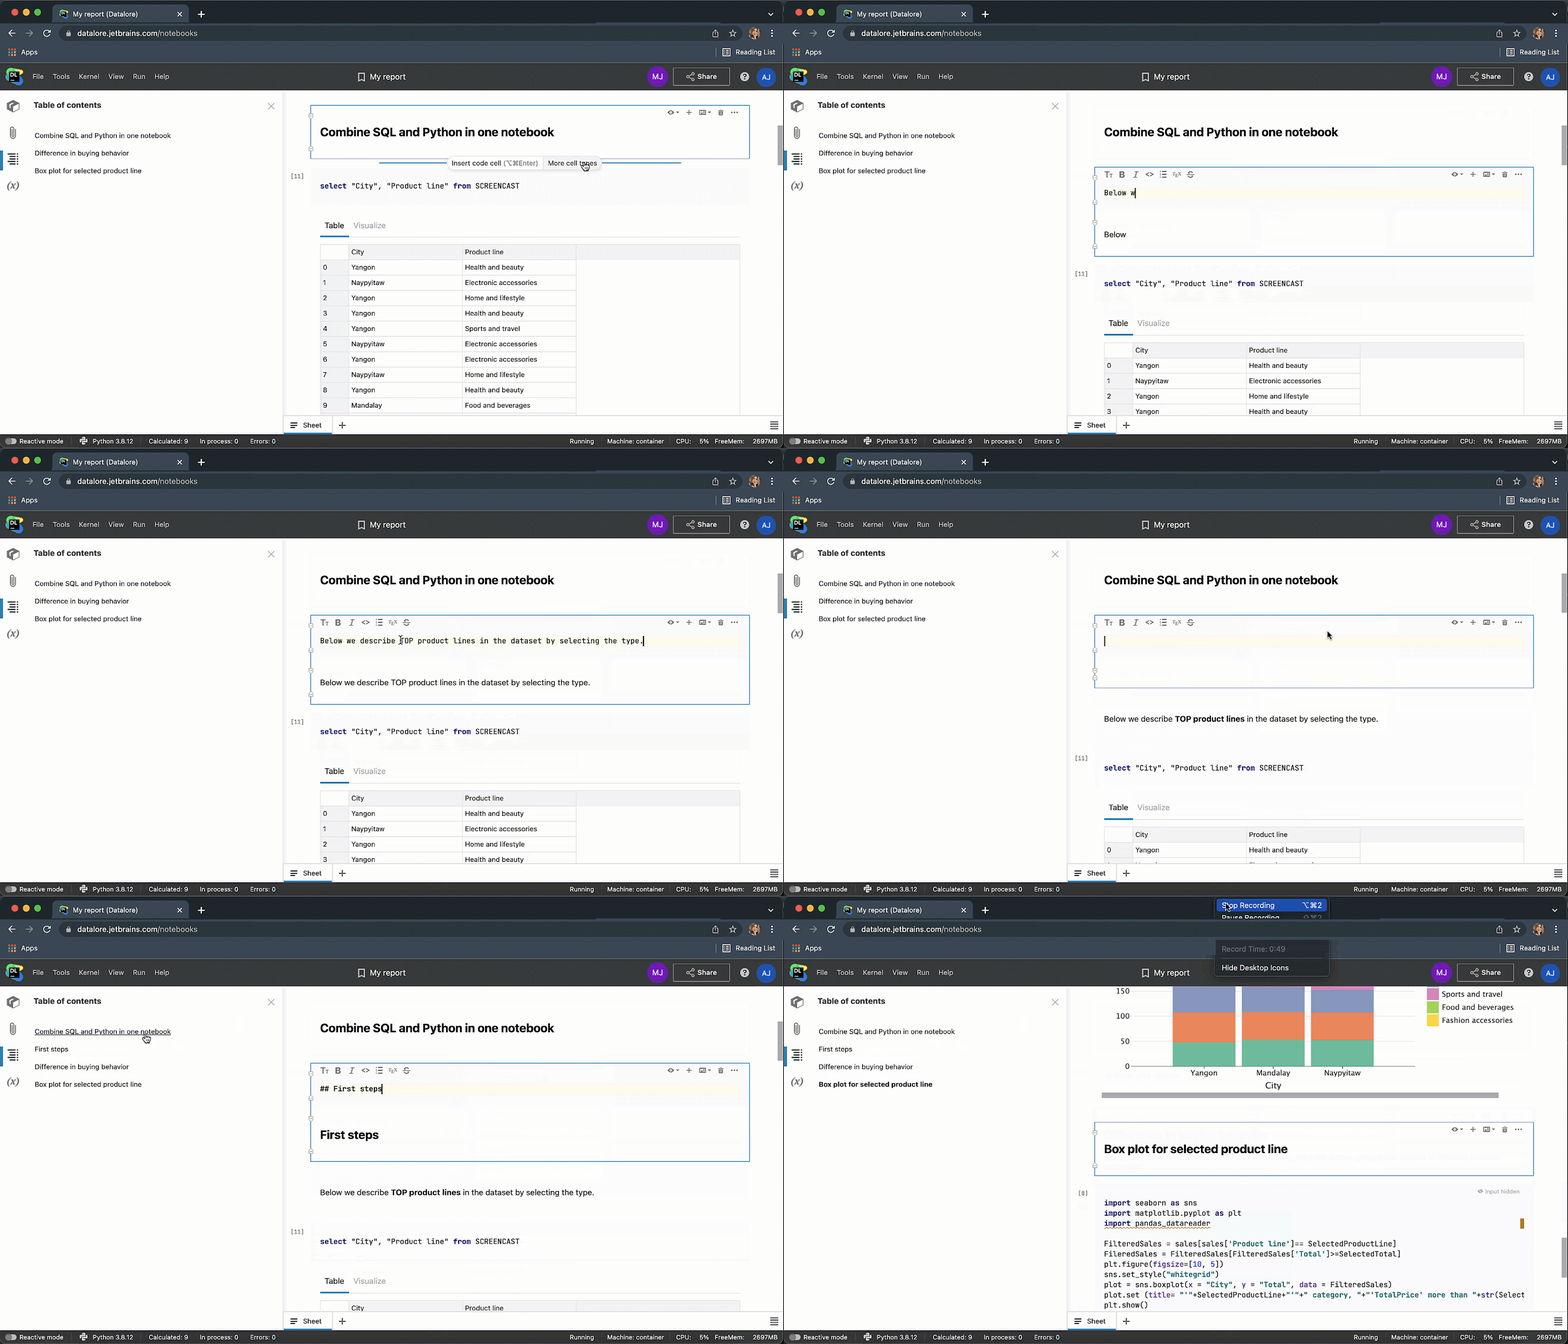
Et voilà! You have a comprehensive data story that is almost ready to be shared…
3. Enrich query results with beautiful charts
Visualizing query results can be done with the click of a mouse in Datalore: just click the Visualize tab in the SQL cell output to get a bunch of out-of-the-box plotting options. You can seamlessly transition to Chart cells for multi-layered plots and other options.
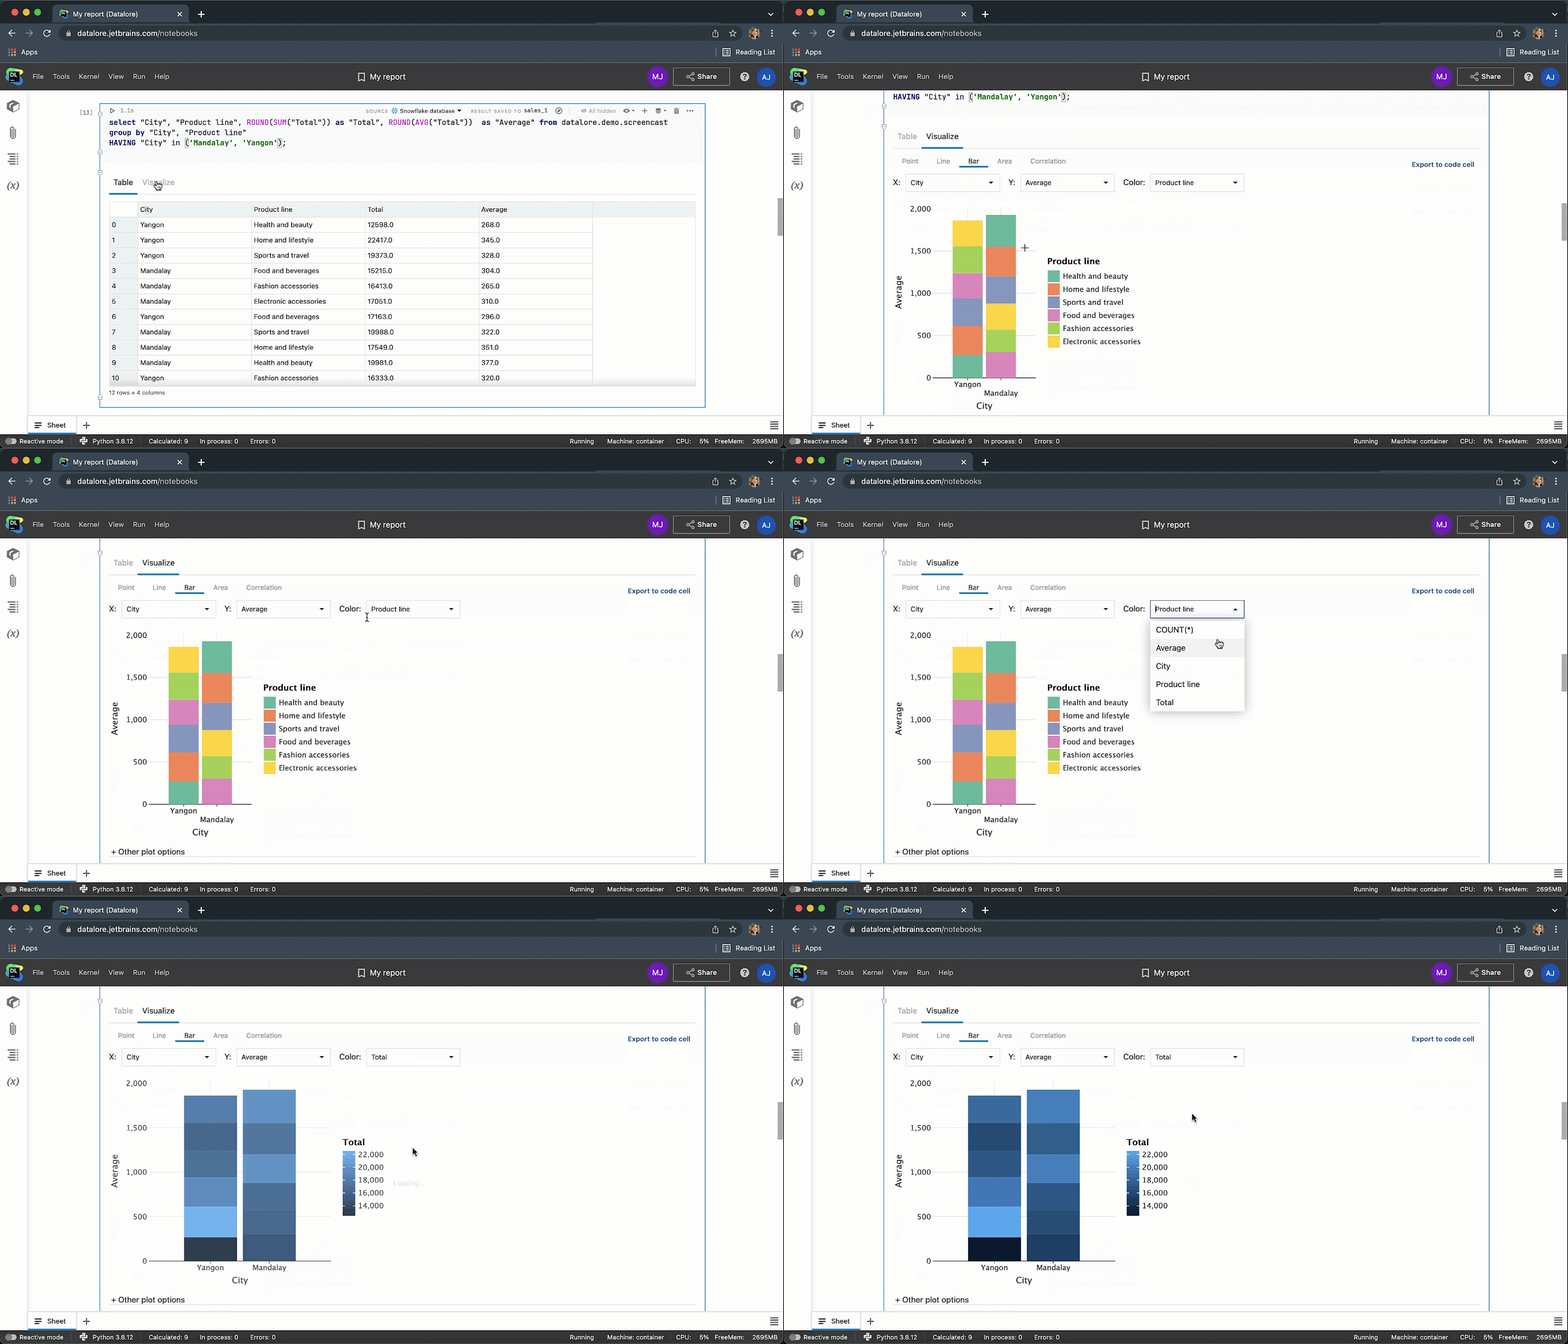
If you want to further customize your visualization, you can export it to a Python code cell, or you can create visualizations from scratch using any Python package of your choice.
4. Collaborate with your team on SQL queries in real-time
As the world increasingly goes remote, it might be hard to get face-to-face help from your colleagues when you really need it.
With Datalore, you and your teammates can hop into the same notebook and edit code together in real-time!
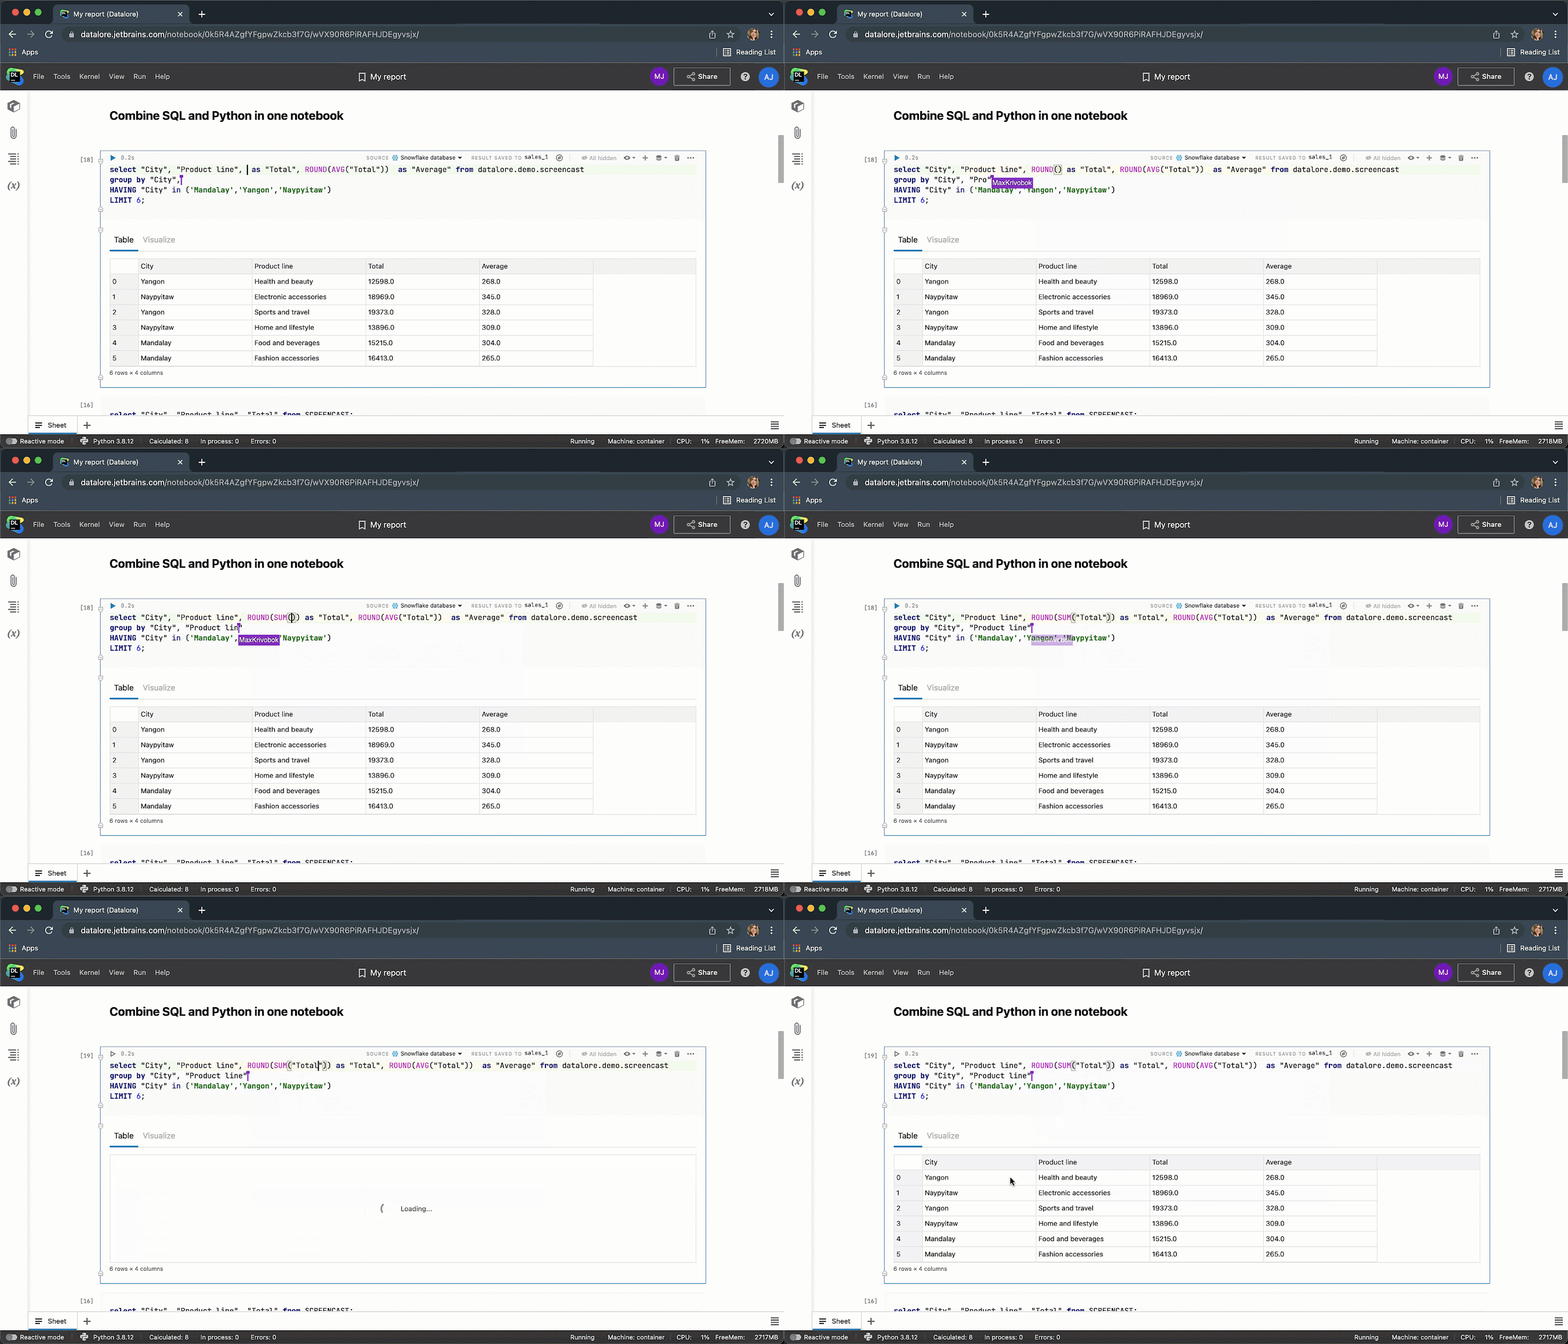
Sharing a notebook is easy — you just need to send a link or an email invitation. You can also specify the access rights, allowing your teammates either to edit the notebook or only to view it.
5. Share results as reports via link
What are the most common ways to share SQL analytics results? They might include sending a message with a resulting table, assembling powerpoint slides, or presenting data with charts in spreadsheets.
But we know a more effective way to share your analytics results. You can turn your notebooks into reports.
In Datalore you can just hit the publish button and the notebook will become available via link, even for people who don’t have Datalore accounts. You can also hide any unnecessary code to make your notebooks look clean.
Now you can put all the tips you have learned here into action and share a beautiful data story.
Interactive reports are only available on the Enterprise plan, please request a trial if you want to try interactive reports at your company.
Check out at how the shared static reports look:
Open static report in Datalore
Are you excited to try out all these features? If so, register for Datalore Community, which is completely free, or consider using Datalore Enterprise if you want to keep your data on-premises.
We hope that these tips were helpful. Don’t forget to follow Datalore and DataGrip on Twitter for more!
The DataGrip and Datalore teams
Subscribe to DataGrip Blog updates

