WebStorm 2018.1 EAP, 181.3263.21: improvements for React Native, extract Vue component
The new WebStorm 2018.1 Early Preview build (181.3263.21) is now available!
You can update via Toolbox App, or download the build here and install it beside your stable WebStorm version.
To learn more about all the new features added in earlier WebStorm 2018.1 EAP builds, please check out these blog posts.
Extract Vue component
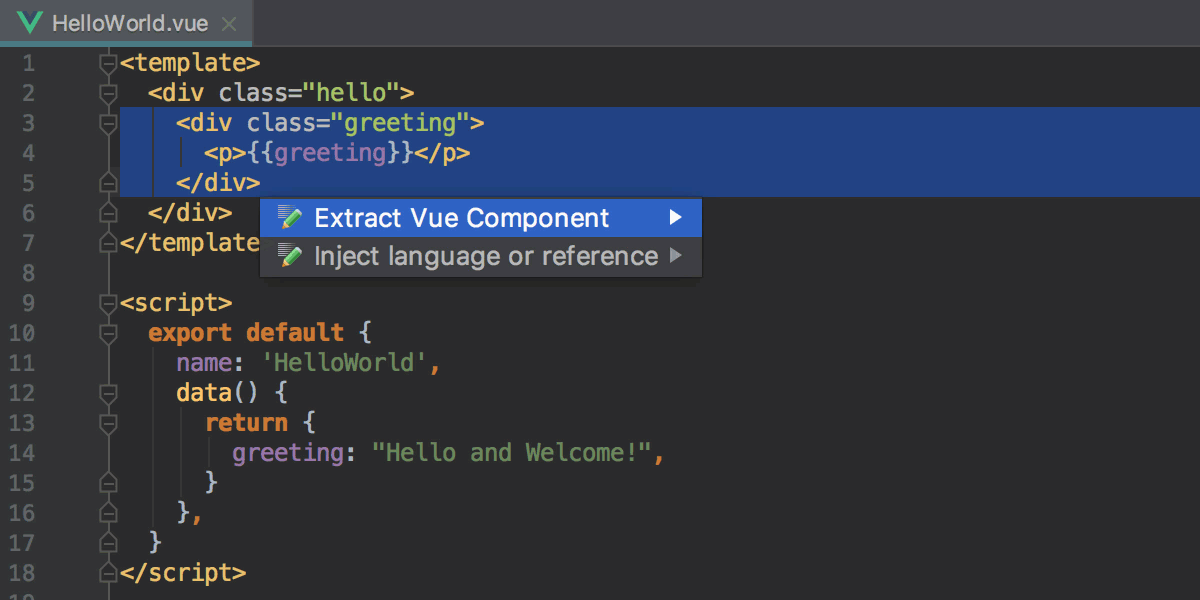
With this new intention you can now easily, without any copy and paste, extract a new Vue component from an existing one.
Select the part of the template you want to extract, press Alt-Enter and select Extract Vue
Component. Then type the name of the new component. WebStorm will create a new single-file component (or warn you if the name you’ve selected is already used or invalid) and import it into the parent component.
All the data and methods used in the extracted template will stay in the parent component and will be passed to a new component with props. The related styles will also be copied.
Running and debugging React Native apps
In the React Native development, we now support several new run and debug scenarios, including debugging with Expo. For that, we had to rework the React Native run/debug configuration significantly.
We would really appreciate your feedback on these changes in the comments: have you managed to successfully set up the configuration? Did it fit into your workflow? Were you able to set up debugging with Expo? Would you prefer to have a separate run configuration for the bundler?
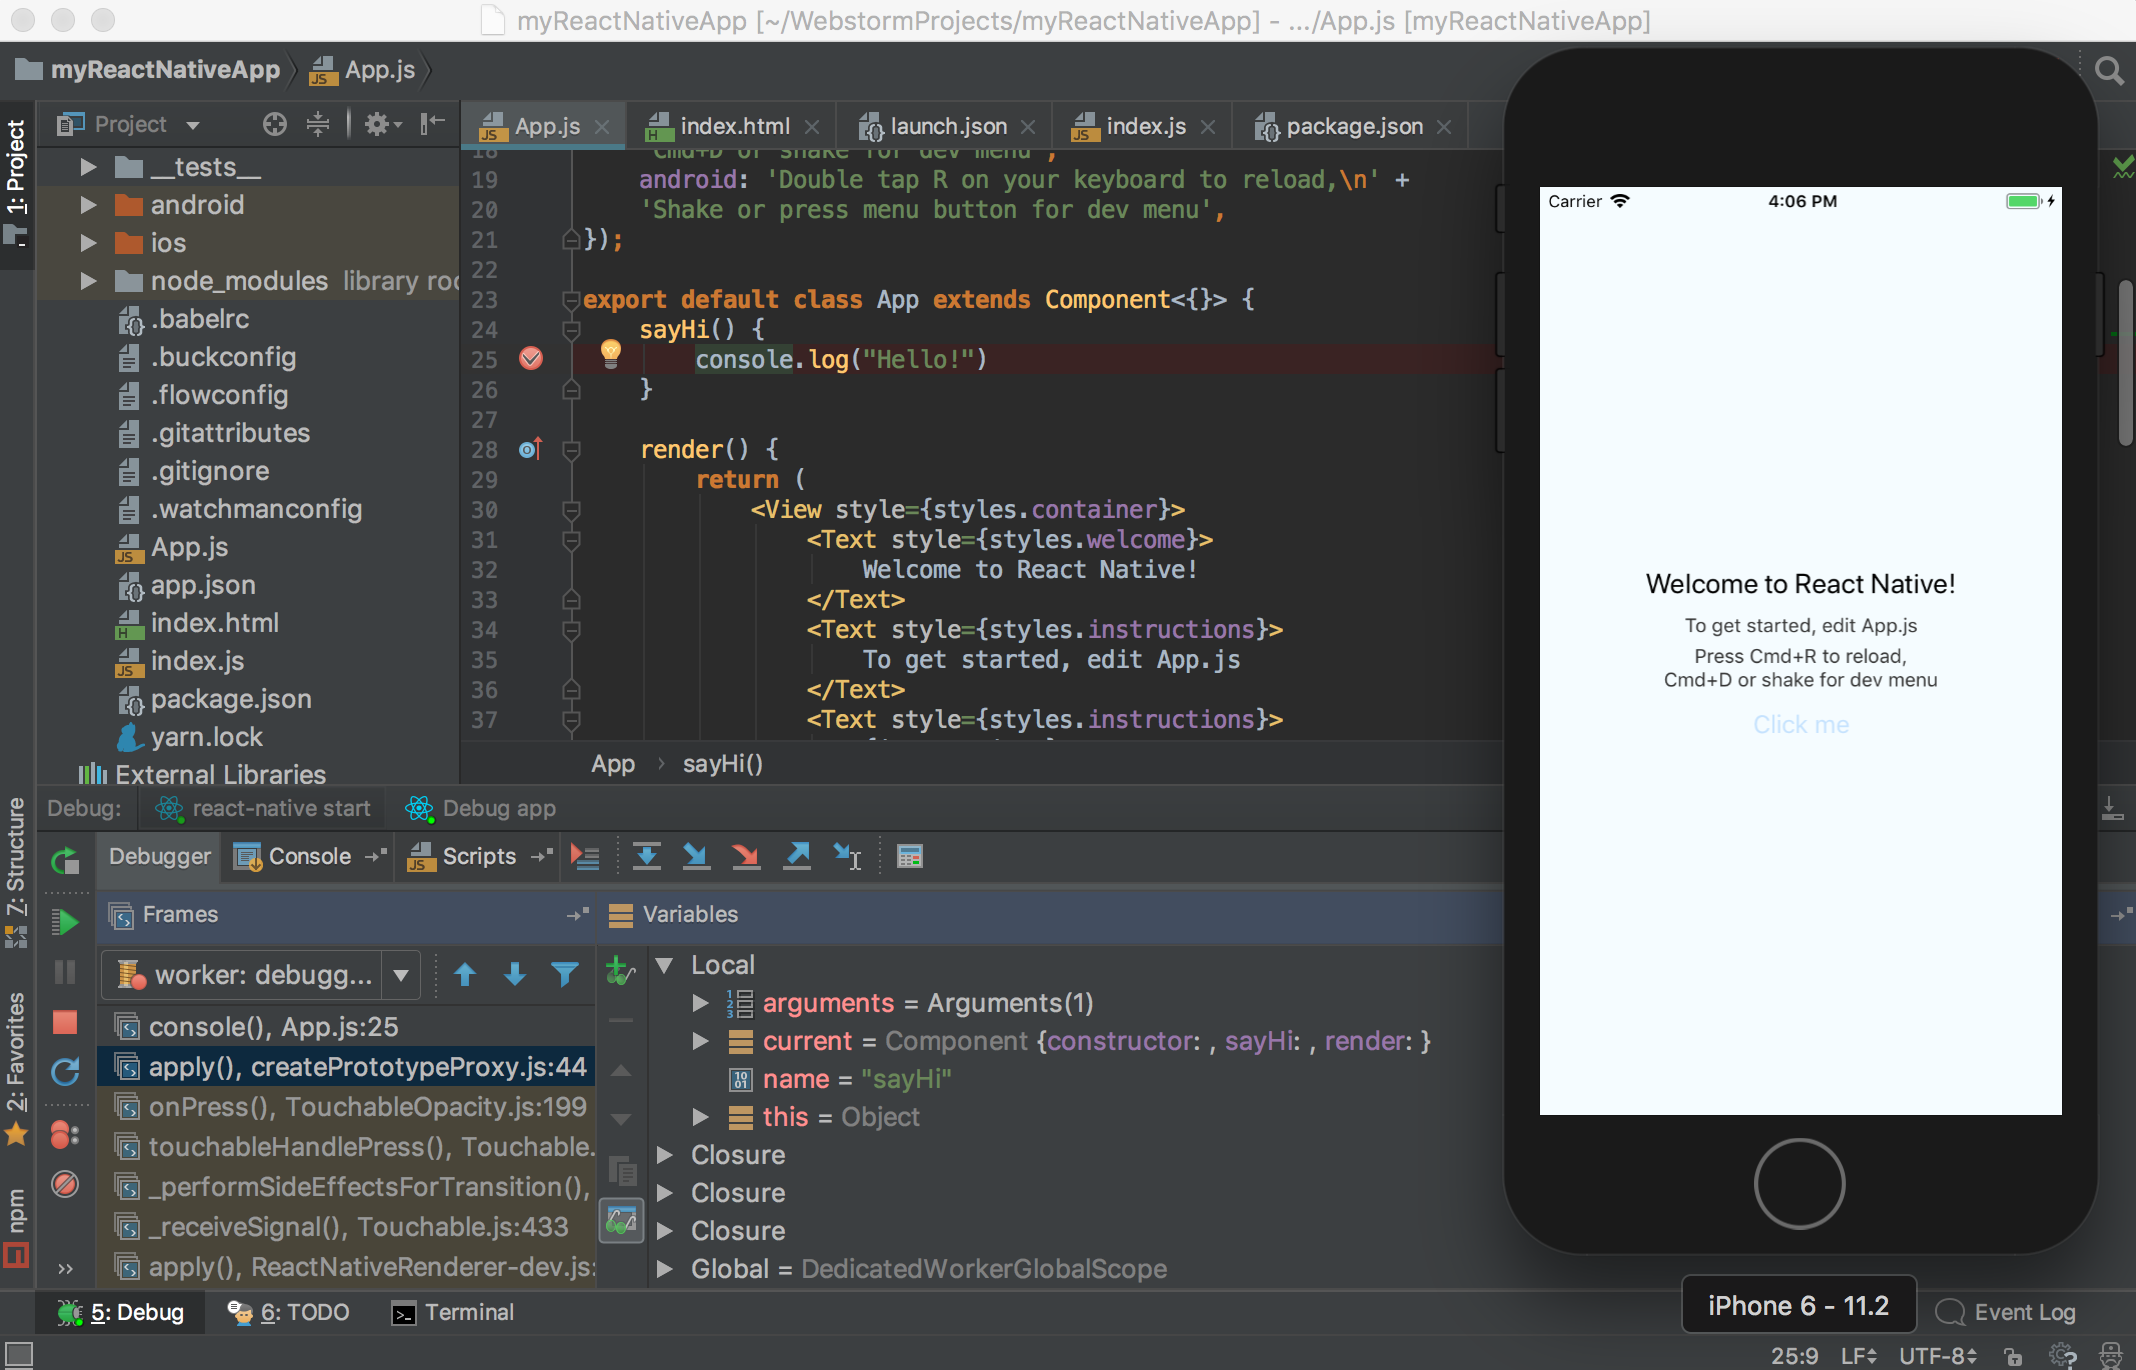
To start your React Native app for the first time, you need to do two things: run React Native bundler/packager and then build and launch an app on a simulator or a device using the react-native run-ios or run-android command. Only after that, you can start debugging it.
However, if you haven’t made any changes to the native code in your application since the last build and the bundler is already running, you don’t really need to rebuild it – you can just open the app in the simulator and then debug.
Therefore, in the updated React Native configuration, you can now select whether to build and open the app in the simulator as part of the run or debug or not – for that there’s now a Build and Launch Application checkbox.
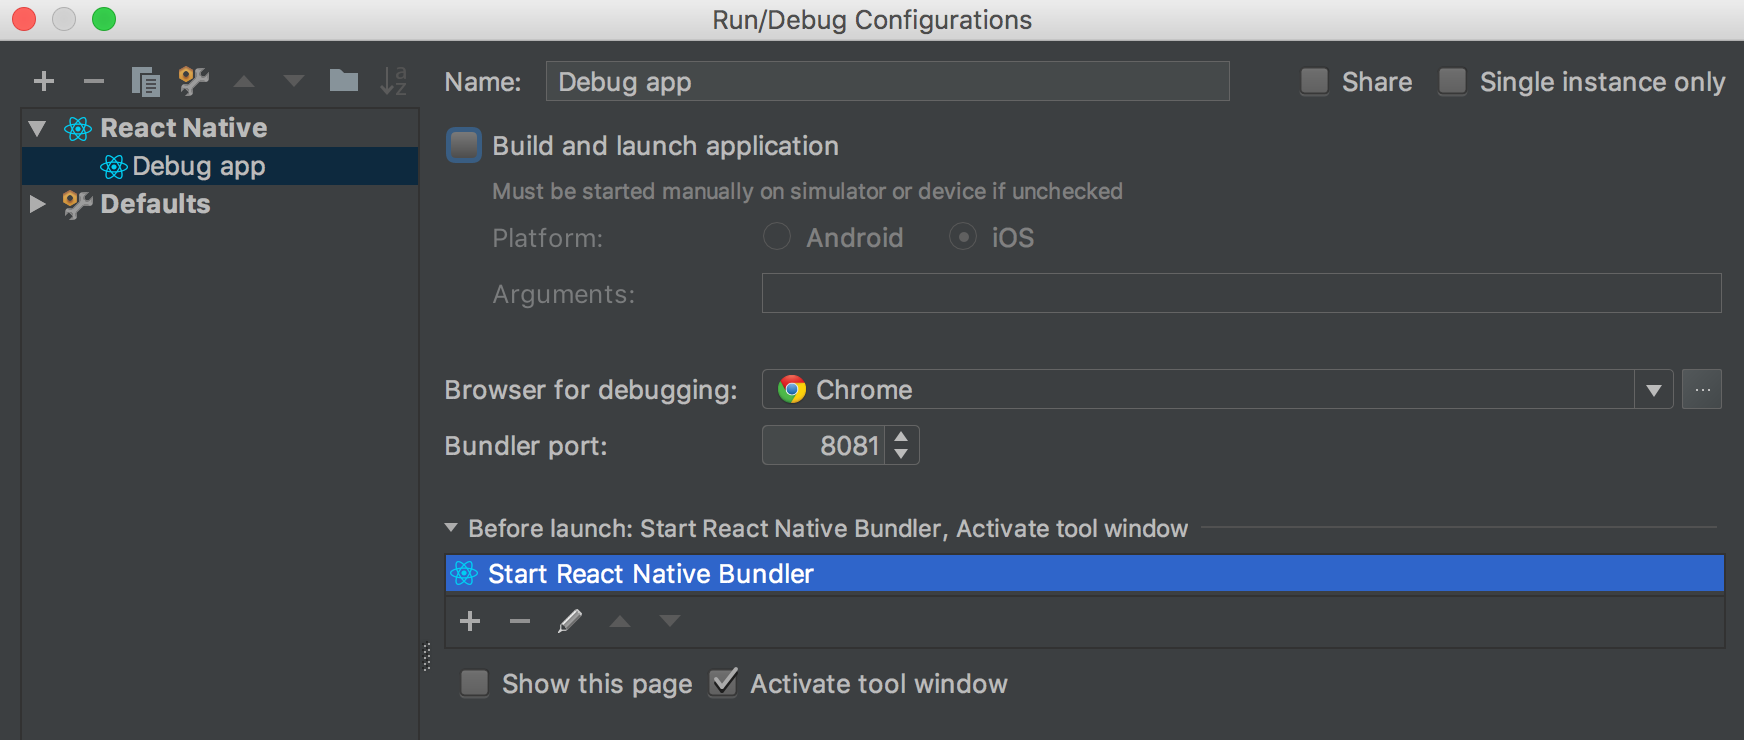
So if it’s unchecked and you start debugging this configuration, WebStorm will run React Native bundler and will wait for you to open an app in the simulator with the Remote debug enabled in the app.
There’s also now more flexibility with running React Native bundler. It’s now listed as a Before Launch task in the React Native configuration. By default, it will run react-native start. You can also select an npm task from your project’s package.json that will start the bundler.
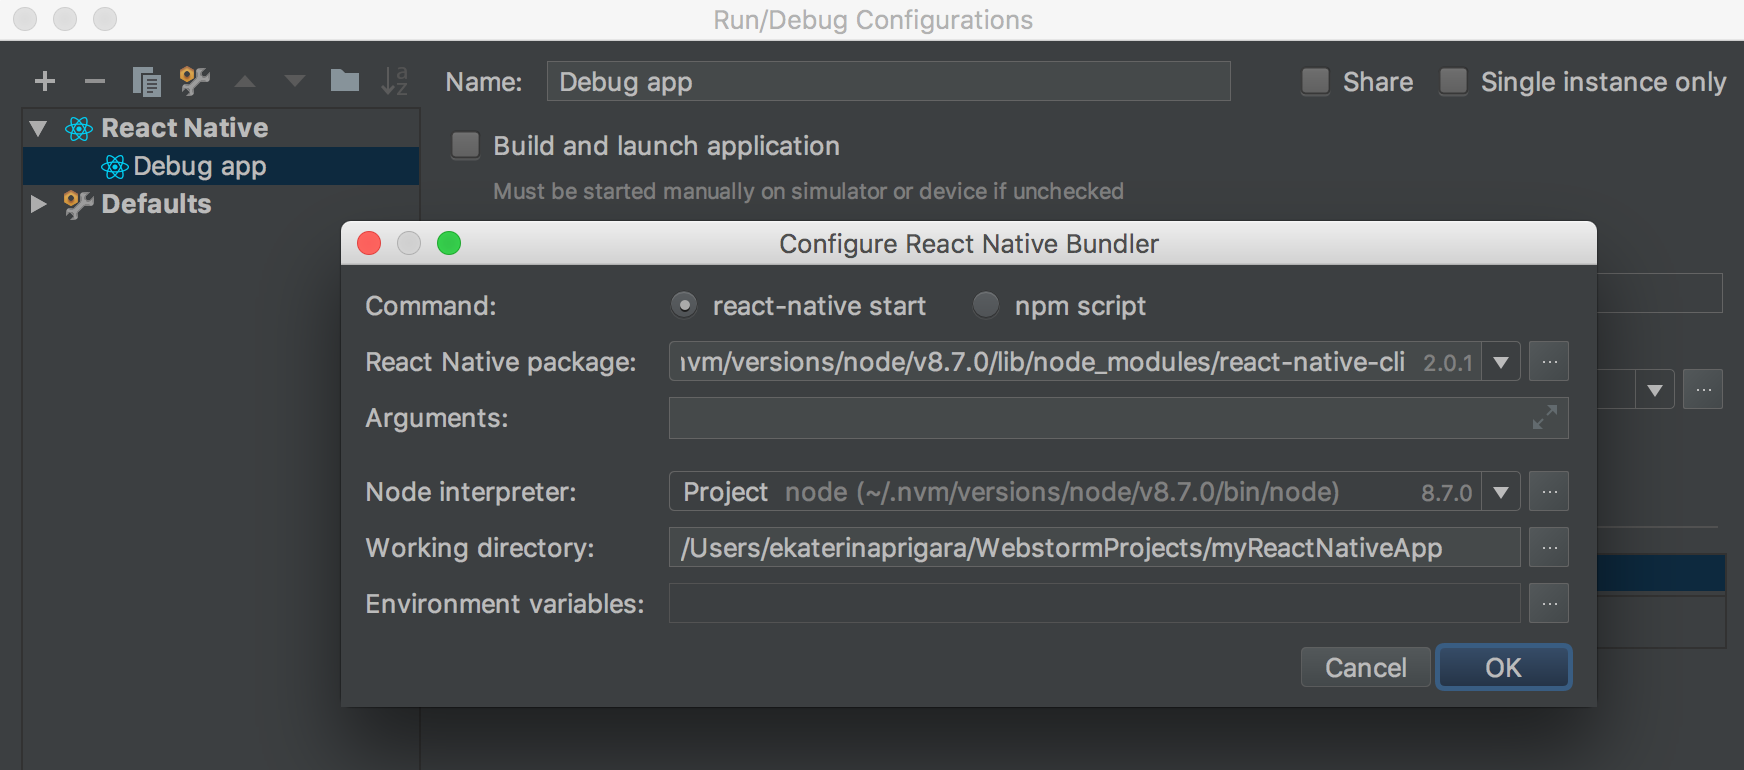
Or if you have bundler already running, you can simply remove this step from the configuration (because you don’t need to run more than one bundler per app).
Update on using node for debugging
Another update is that we have deprecated using Node.js as a backend for React Native debug process. We now rely on Chrome for debugging, which is used by React Native itself. The main reason for this decision was that node implementation was difficult to maintain for different react-native and node versions.
Right now, when you start debugging React Native apps, WebStorm starts a new Chrome instance and attaches to it. You can use DevTools together with WebStorm to debug the app.
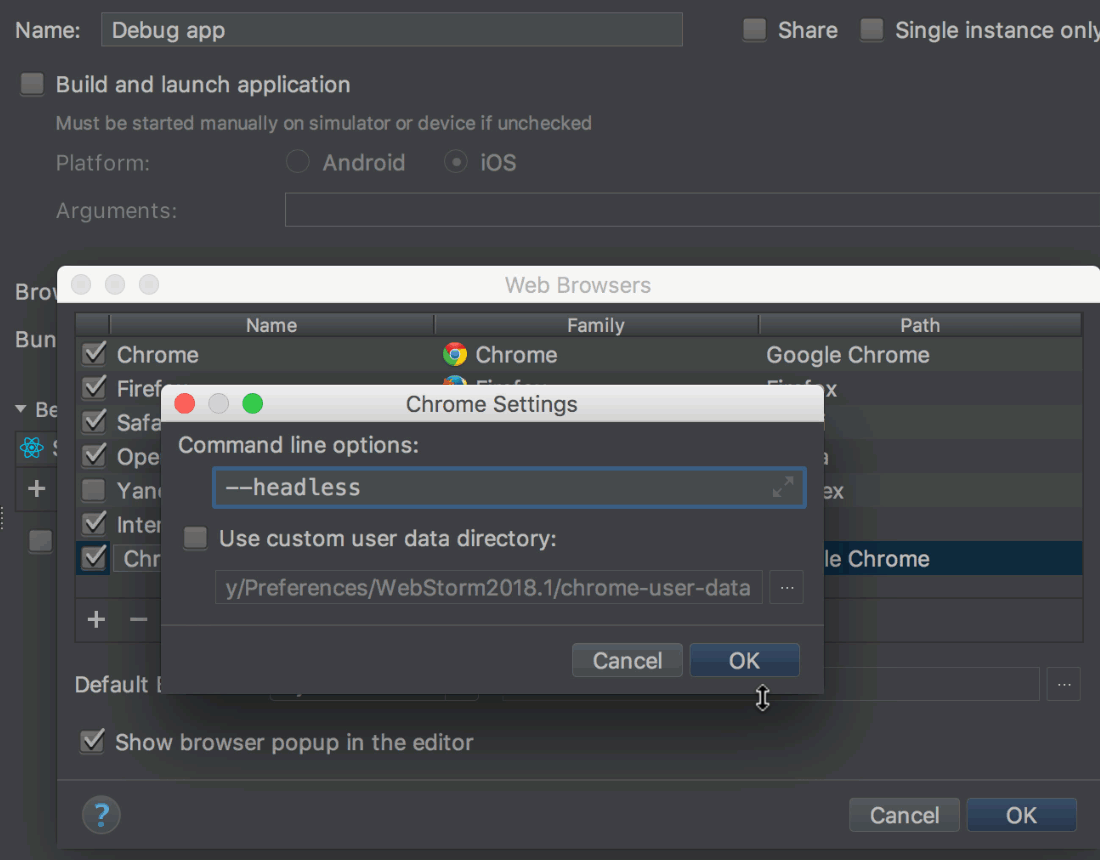
If you don’t want to see any new Chrome windows, you can add --headless flag to the Chrome settings in React Native debug configuration. Note that in this case, Chrome Headless will keep running after you’ve stopped debugger in WebStorm.
Debugging React Native apps that use Expo
You can now debug React Native apps that use Expo in WebStorm.
To do that, you need to create a new React Native configuration. In it, disable Build and Launch application (since Expo takes care of it).
Instead of react-native start we need to run the npm task start to run the dev server – we can configure that if we click the edit icon next to the
Start React Native Bundler task.
One last thing that we need to do is change the port used to connect to the bundler. In Expo it’s 19001.
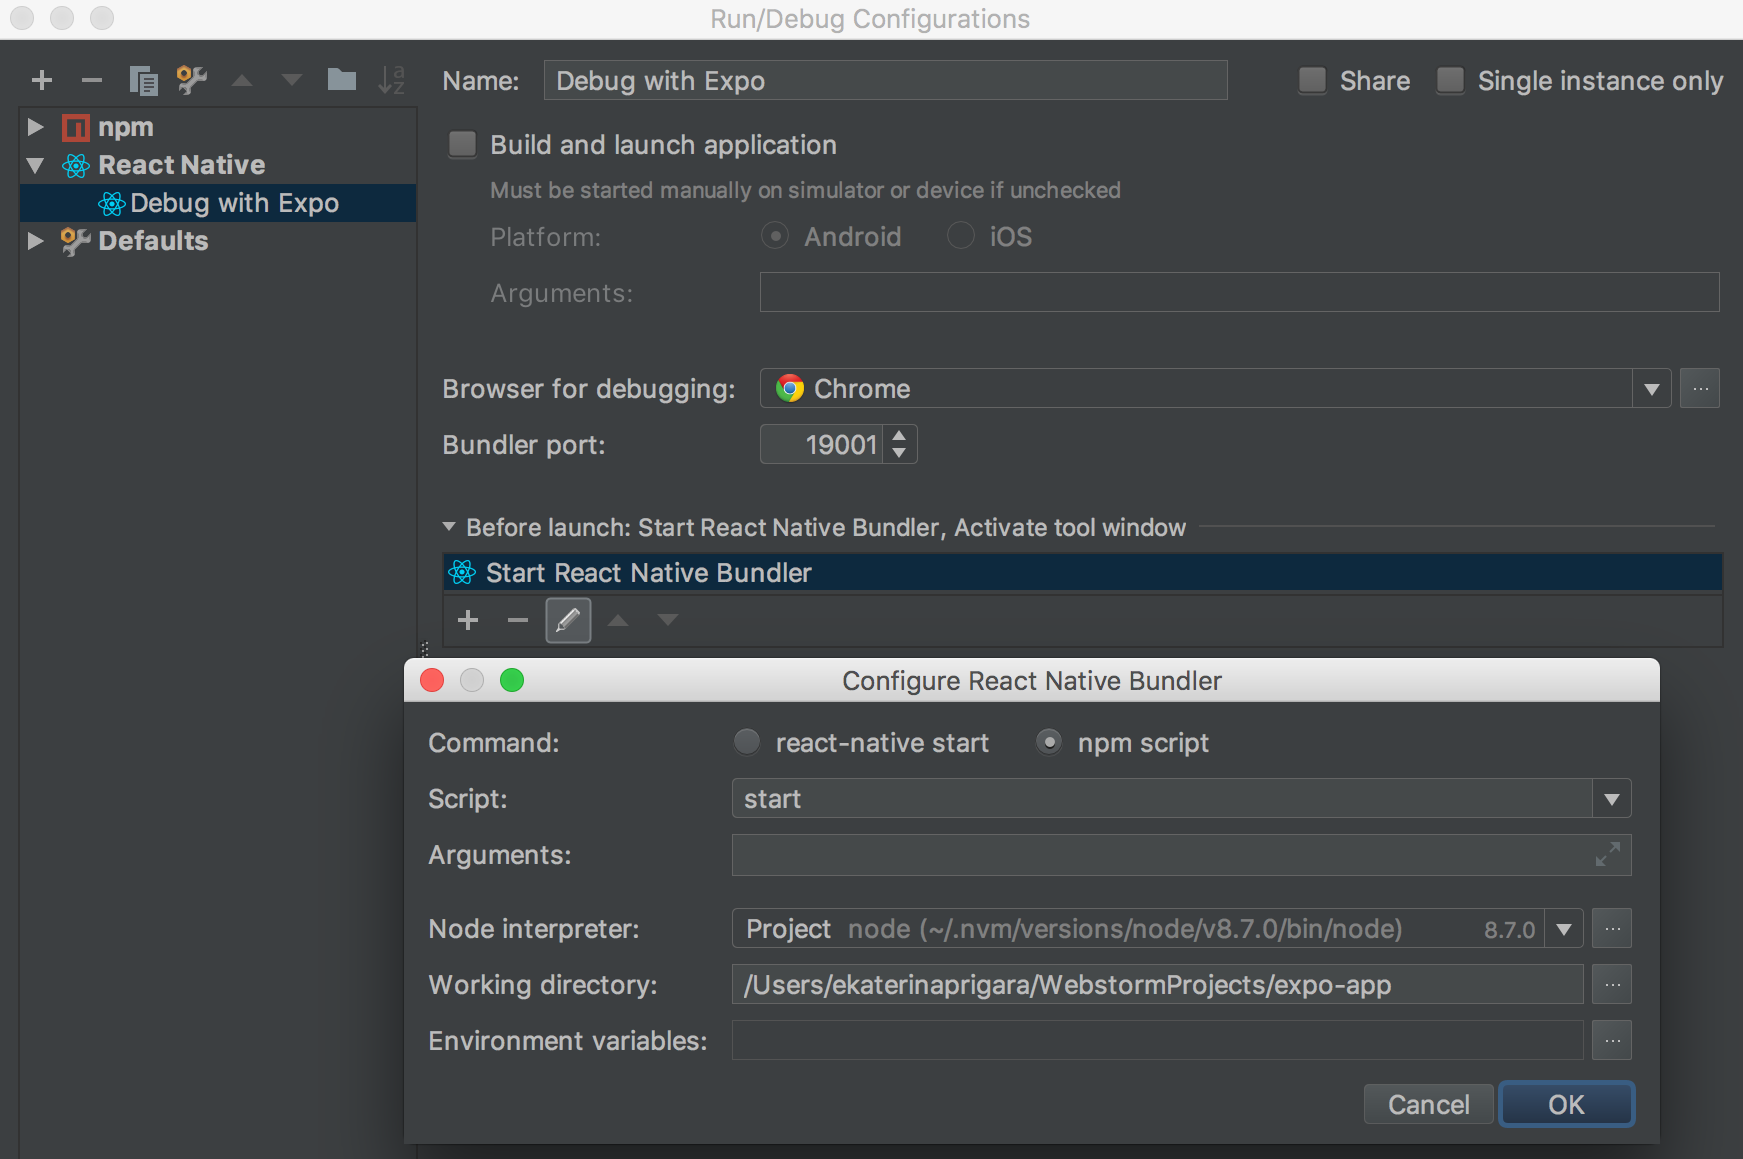
Save the configuration and hit debug. Then open Expo client app on your phone or simulator, select the current app and enable remote debugging.
Showing expression info
As you might know, if you hold Cmd or Ctrl and hover over a symbol in JavaScript or TypeScript, you will see some information about it, for example, where and how it’s defined and in TypeScript also the type information.
In WebStorm 2018.1 we have significantly reworked the way this information is presented. We made the presentation of type info more consistent for different cases.
WebStorm 2017.3

WebStorm 2018.1
WebStorm 2017.3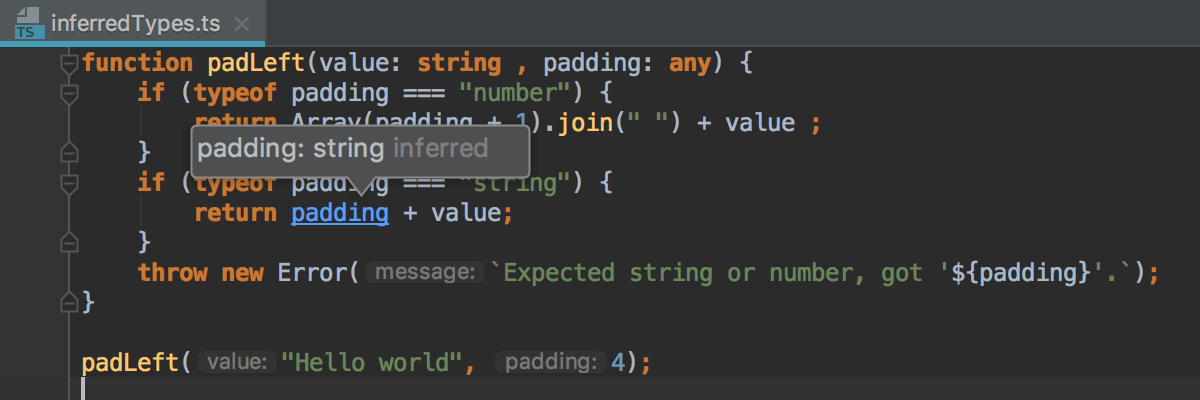
WebStorm 2018.1
We hope that with these improvements, this feature will become much more useful.
Please share your feedback and report issues on our tracker. Thank you!
WebStorm Team

