The GoLand 2026.2 Early Access Program Has Started

The Early Access Program (EAP) for GoLand 2026.2 is now open. It’s a great opportunity to try upcoming features for free and help shape the product.
EAP builds give you early access to what we’re working on, so you can test new functionality in your real workflows and share feedback with the GoLand team. Your input directly influences what makes it into the final release.
If you are new to the EAP, here is how it works:
- The EAP allows you to try new features before the final release.
- New EAP builds are released regularly during the cycle.
- Builds are still in development and may be unstable.
- Builds are free for the whole EAP cycle until Beta.
- Your feedback helps us improve the product.
- During the EAP, we will also share a survey. Participating gives you a chance to receive a free GoLand subscription or an Amazon Gift Card.
In this release cycle, we’re focusing on performance insights, memory optimization, and smoother project onboarding. The goal is simple. You should be able to understand your Go program’s behavior and optimize its performance without leaving the IDE.
You can download the first EAP build from the Toolbox App, from our website, or by updating from inside the IDE.
Disclaimer
We continue to work on performance tooling, analysis accuracy, and workflow improvements throughout the EAP cycle.
You can explore the full list of tasks and features we are currently working on in our roadmap.
This roadmap reflects our current priorities. Plans can change as we collect feedback and validate ideas during the EAP.
What we’re planning for GoLand 2026.2
This EAP cycle introduces a new set of tools for performance analysis and several improvements to everyday workflows.
Get insight into performance without leaving the IDE
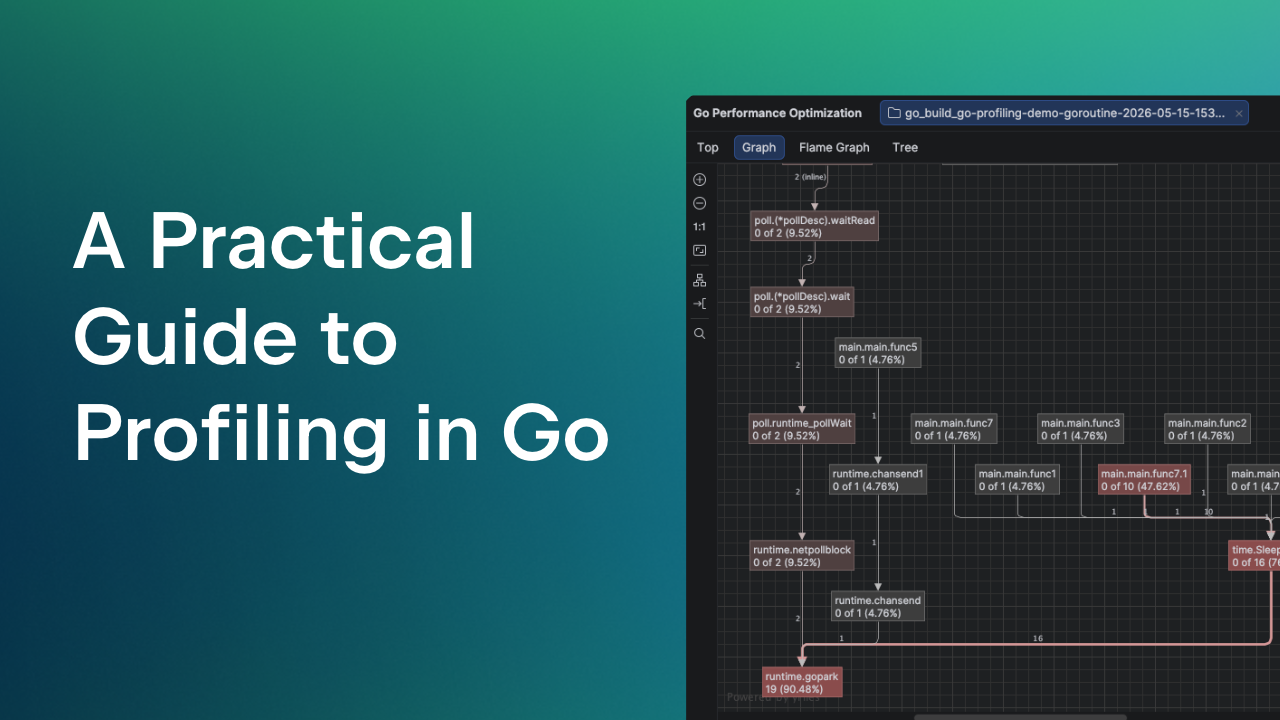
Evaluate your program from the Go Performance Optimization tool window
You can now access all performance tools in one place. The new Go Performance Optimization tool window brings together profiling, escape analysis, and struct optimization.
You no longer need to switch between different tools or workflows. You can analyze CPU usage, memory behavior, and allocation patterns from a single UI.

Profile any Go application with pprof
You can now run profiling for both tests and regular run configurations.
The profiler is based on pprof and integrates directly into the IDE. It helps you answer key questions about your program:
- Where does the program spend CPU time?
- How much memory does it allocate and retain?
- Which parts of the code create excessive allocations?
- What goroutines are running and where are they blocked?

A variety of profiling types are included:
- The CPU profiler shows where your program spends CPU time during active execution. It samples running goroutines and helps you find CPU-intensive code paths.
- The Heap and Allocs profilers track memory usage and allocation patterns. Both collect the same allocation data but use different default views. The Heap profile shows memory that is currently in use, while the Allocs profile shows total memory allocated over time, including memory that has already been freed.
- The Goroutine profiler shows all current goroutines and their stack traces. It helps you understand what goroutines are doing and identify issues such as leaks or deadlocks.
- The Block profiler shows where goroutines are blocked by synchronization operations, such as channel operations or locks. It helps you find delays caused by code that is waiting instead of being executed.
- The Mutex profiler shows lock contention between goroutines. It helps you identify where goroutines block each other when accessing shared data.
There are a few ways to start profiling:
- From the run configuration selector on the toolbar.

- From the gutter next to the
mainfunction or a test.
- From the Go Performance Optimization tool window.

- From the Run tool window by using Rerun with Profiler.

Detect unnecessary heap allocations with escape analysis
Escape analysis helps you understand when values move from the stack to the heap.
A stack allocation is fast and short-lived. A heap allocation is slower and requires garbage collection. When values escape to the heap unnecessarily, they increase memory usage and reduce performance.
GoLand highlights these cases directly in the editor. You can see:
- Which variables escape.
- Why they escape.
- How the data flows through your code.

Optimize struct layouts for better memory usage
GoLand now helps you improve the layout of your structs, allowing you to conserve memory.

In Go, field order affects memory alignment. Poor alignment introduces padding and increases the size of a struct.
For example:
type Inefficient struct {
    A byte  // 1 byte
    B int32 // 4 bytes
    C byte  // 1 byte
}
The struct is laid out in memory as follows. Field A occupies 1 byte. The next 3 bytes are padding to align field B to a 4-byte boundary. Field B then occupies 4 bytes, while field C occupies 1 byte. After that, another 3 bytes of padding are added so that the total struct size matches the largest alignment requirement. As a result, the struct takes 12 bytes in total, even though the fields themselves require only 6 bytes.
The optimal layout of fields in the struct goes as follows:
type Efficient struct {
    B int32 // 4 bytes
    A byte  // 1 byte
    C byte  // 1 byte
}
GoLand detects suboptimal layouts and suggests a quick-fix. This helps you reduce the memory footprint without changing program behavior.
See CPU and memory usage in real time
You can now monitor CPU and memory usage while your program runs.

Live charts are available in:
- The Run tool window.
- The Go Performance Optimization tool window.
This gives you immediate feedback. You can see how changes in code affect resource usage without running a full profiling session.
Start projects faster with automatic run/debug configurations
GoLand can now detect main packages in your project and create run/debug configurations automatically.
When you open a project, the IDE:
- Scans for executable entry points.
- Creates run configurations, reducing manual setup.
Share your feedback
Your feedback shapes GoLand.
Try the new features in your projects and tell us what works and what doesn’t. Report issues and vote for features in our issue tracker.
Happy coding,
The GoLand team