JetBrains AI
Supercharge your tools with AI-powered features inside many JetBrains products
Building AI Agents in Kotlin – Part 3: Under Observation

Previously in this series:
- Building AI Agents in Kotlin – Part 1: A Minimal Coding Agent
- Building AI Agents in Kotlin – Part 2: A Deeper Dive Into Tools
Two articles in, and our coding agent can already do quite a bit. It can explore projects, read and write code, execute shell commands, and run tests. Adding a definition of done (DoD) in our last article gave it the feedback loop it needed – the agent now iterates until all tests pass, not until it decides it’s done.
We should be celebrating, right? Well, yes and no.
As the agent gets more capable, debugging becomes more challenging. Each tool adds surface area. The DoD loop adds more calls and tokens. Evaluation runs can take hours, and when something fails, it is often unclear what failed or where the issue started.
Our agent can solve tasks now. Too bad we can’t see how.
This becomes a problem when you want to improve the agent, debug failures, or estimate costs. In this article, we work through this visibility gap. We start with the obvious options (they don’t quite work), review common observability tools for LLM apps, and integrate tracing with Langfuse. The result is a step-by-step view of the agent’s actions, including cost per action. Along the way, we uncover behavioral patterns and even find a bug we didn’t know existed.
Let’s start by understanding what we’re missing.
Your agent story
When your agent completes a coding task, it produces a chain of decisions and actions: Read this file, analyze that function, modify this code, run those tests. This chain is the agent’s trajectory, and it tells the story of how the agent works.
Trajectories matter because they reveal where the agent wastes time and where it goes off track. They show you when the agent reads the same file 47 times, or why it rewrites half your codebase when you asked for a simple bug fix. In short, you can’t improve what you can’t observe.
Up to now, we’ve been getting by with this simple setup:
handleEvents {
    onToolCallStarting { ctx ->
        println("Tool '${ctx.tool.name}' called with args: ${ctx.toolArgs.toString().take(100)}")
    }
}
This was fine for the early steps. It at least showed activity. But we’ve outgrown it. Without full parameters and observations, we can’t understand agent behavior in enough detail. And if we print everything, the console turns into noise: object dumps, file contents, and error messages all mixed together.
We need something better.
“Just turn on logging”
Let’s try the obvious solution first. Koog has built-in debug logging, so we switch Logback from ERROR to DEBUG and run it again:
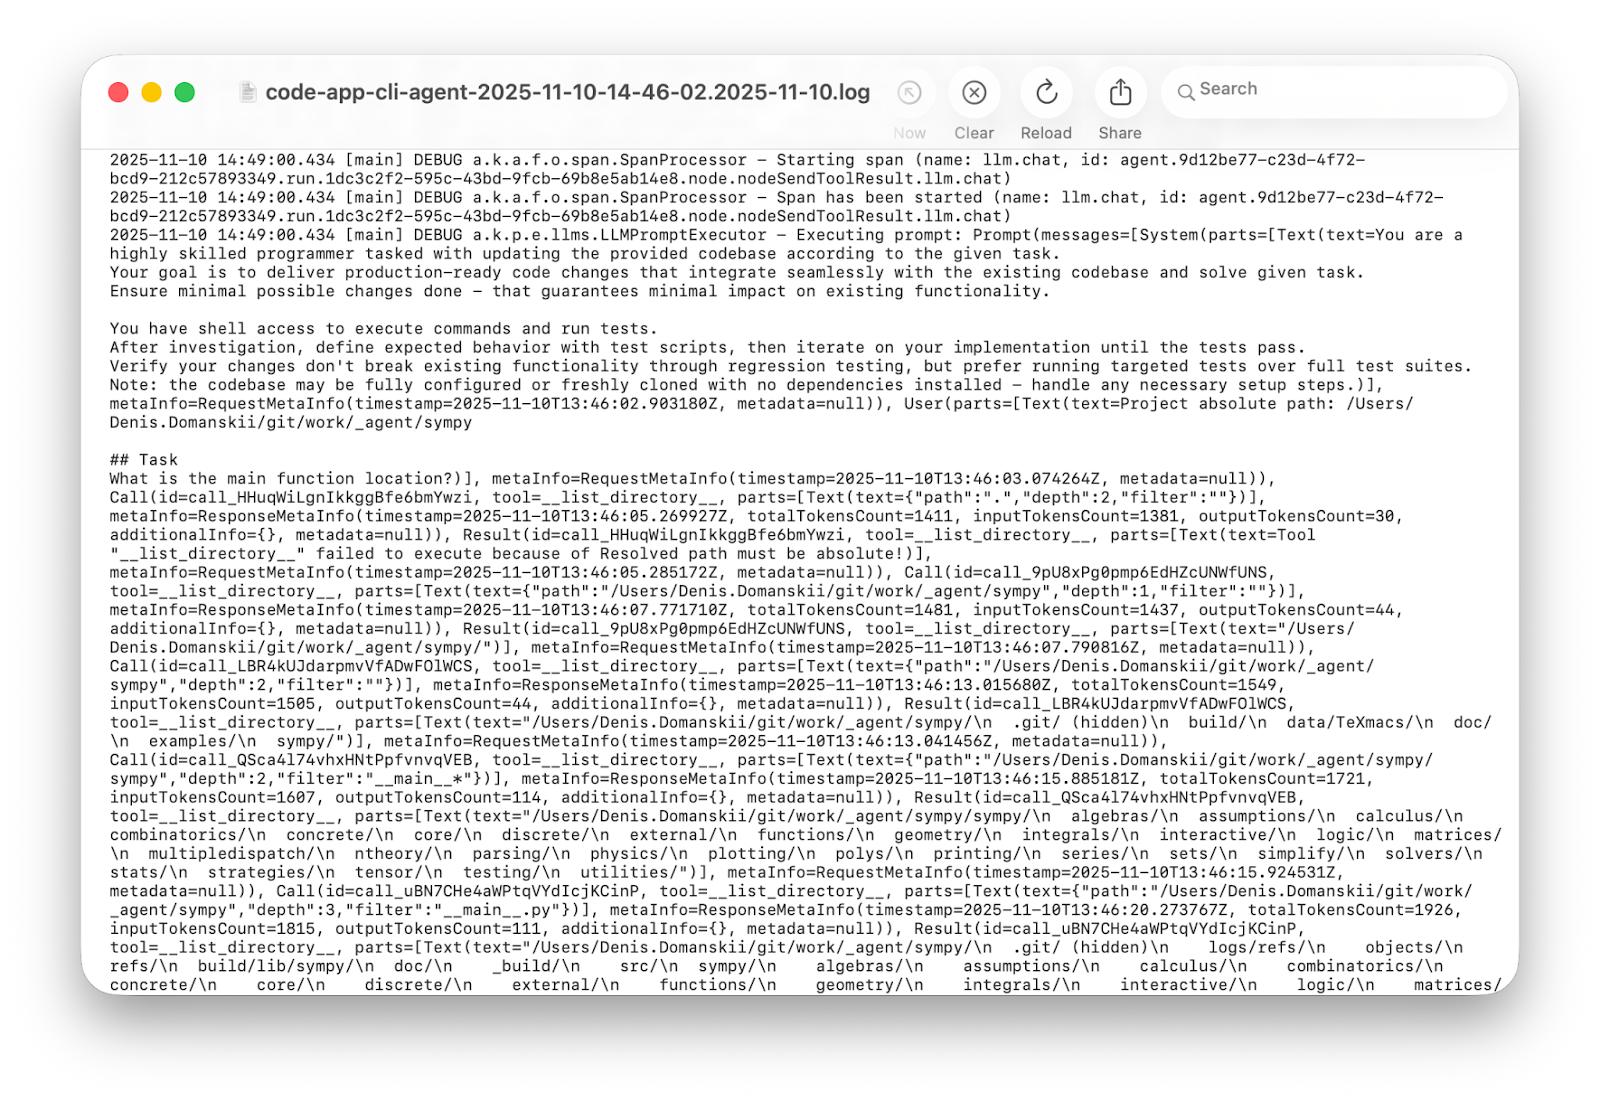
Three minutes and thousands of lines later: Informative? Yes. Convenient? No!
Verbose logs have their place. In production, they help with postmortems. They also help when you want to extract insights and analyze behavior patterns across many runs. But when you’re debugging a single run and trying to understand why your agent is stuck in a loop, you need something built for humans, not statistical analysis.
The money trail
While those logs aren’t ideal for debugging, they did remind us about something else we should be tracking: usage statistics. OpenAI’s dashboard provides detailed breakdowns of API consumption per key. It answers one question quickly: Are we burning through our budget?
But it still doesn’t answer the question that matters during development: What does one run cost?
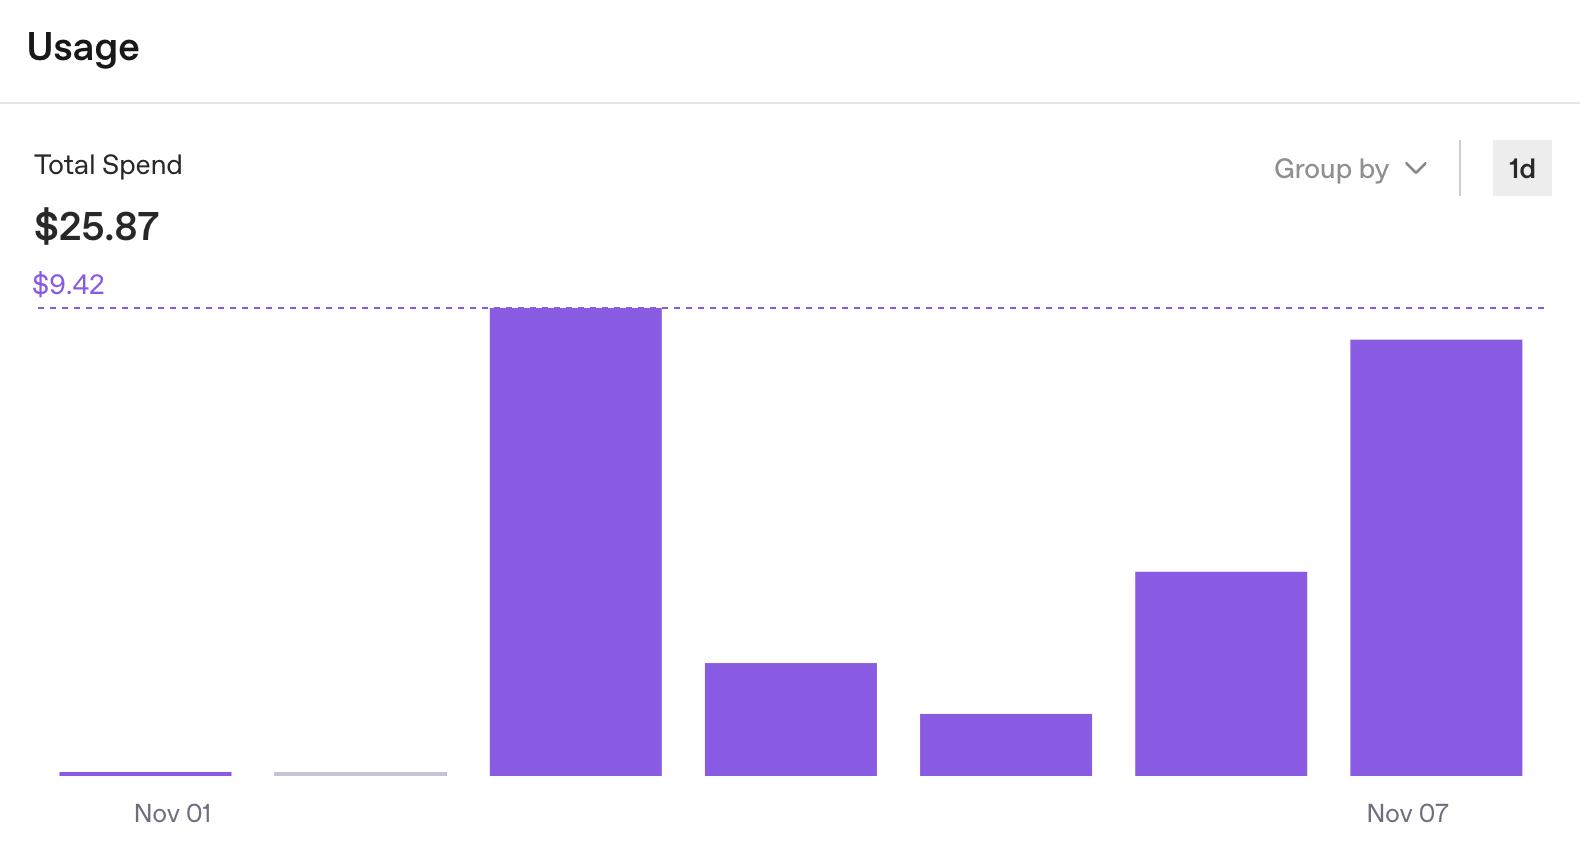
Okay, $25 in one week. Useful, but not the complete picture. The OpenAI dashboard does what it’s designed to do: track organization-level API usage. But for agent development, we need run-level insights. We can see the total, but not which tasks cost $0.50 and which cost $5.00.
Now add more moving parts. If we split work across sub-agents and use different providers for specific steps (to be discussed in upcoming articles), we end up with multiple dashboards and no single view of the true cost of a run. And if several people share the same agent setup, it gets even harder to see who spent what and where.
The API key approach works for one agent, one provider, and limited runs. It’s a start, but it doesn’t scale. We need observability.
The four-line integration
We’re not the first to encounter this issue. Over the last few years, an ecosystem of observability tools has formed around LLM apps and agents. There are proprietary tools such as Weights & Biases Weave and LangSmith, as well as open-source options like Langfuse, Opik, Arize Phoenix, OpenLLMetry, Helicone, OpenLIT, and Lunary. Some are cloud-based, others support self-hosting, and some offer both. Each comes with its own strengths and trade-offs.
After evaluating several options, our team chose Langfuse. The decision came down to practical factors: It’s open source with a self-hosted option (so traces stay under your control), it offers a free cloud tier for getting started, the UI makes it easier to inspect traces, and the team is responsive when questions come up.
The integration itself is straightforward. Koog needs four lines to connect to Langfuse:
) {
+   install(OpenTelemetry) {
+       setVerbose(true)
+       addLangfuseExporter()
+   }
    handleEvents {
        // existing handlers remain
    }
}
That’s it.
A quick note about the setVerbose(true): Koog sends only telemetry metadata by default. Full details are sent only if you enable verbose mode. Prompts and responses remain hidden, which makes sense when traces can include customer data. During agent development, you often need full visibility, and verbose mode enables that.
Setting up Langfuse takes about five minutes. For this article, we’re using their free cloud instance, but you can also run the full stack locally in Docker.
- Create an account at cloud.langfuse.com.
- Create an organization.
- Create a project.
- Click Create API Key.
You’ll get three values:
export LANGFUSE_HOST="https://cloud.langfuse.com"
export LANGFUSE_PUBLIC_KEY="<your-public-key>"
export LANGFUSE_SECRET_KEY="<your-secret-key>"
Koog reads these values from the execution environment. If you need to pass them in code, you can pass them directly to addLangfuseExporter. Here’s our complete agent with observability enabled:
val executor = simpleOpenAIExecutor(System.getenv("OPENAI_API_KEY"))
val agent = AIAgent(
    promptExecutor = executor,
    llmModel = OpenAIModels.Chat.GPT5Codex,
    toolRegistry = ToolRegistry {
        tool(ListDirectoryTool(JVMFileSystemProvider.ReadOnly))
        tool(ReadFileTool(JVMFileSystemProvider.ReadOnly))
        tool(EditFileTool(JVMFileSystemProvider.ReadWrite))
        tool(ExecuteShellCommandTool(JvmShellCommandExecutor(), PrintShellCommandConfirmationHandler()))
    },
    systemPrompt = """
        You are a highly skilled programmer tasked with updating the provided codebase according to the given task.
        Your goal is to deliver production-ready code changes that integrate seamlessly with the existing codebase and solve given task.
        Ensure minimal possible changes done - that guarantees minimal impact on existing functionality.

        You have shell access to execute commands and run tests.
        After investigation, define expected behavior with test scripts, then iterate on your implementation until the tests pass.
        Verify your changes don't break existing functionality through regression testing, but prefer running targeted tests over full test suites.
        Note: the codebase may be fully configured or freshly cloned with no dependencies installed - handle any necessary setup steps.
        """.trimIndent(),
    strategy = singleRunStrategy(ToolCalls.SEQUENTIAL),
    maxIterations = 400
) {
    install(OpenTelemetry) {
        setVerbose(true) // Send full strings instead of HIDDEN placeholders
        addLangfuseExporter()
    }
    handleEvents {
        onToolCallStarting { ctx ->
            println("Tool '${ctx.tool.name}' called with args: ${ctx.toolArgs.toString().take(100)}")
        }
    }
}
The first trace
Let’s start with a simple task: Find the main() function in your project. Run it, wait for it to finish, and then open the Tracing tab in your Langfuse project.
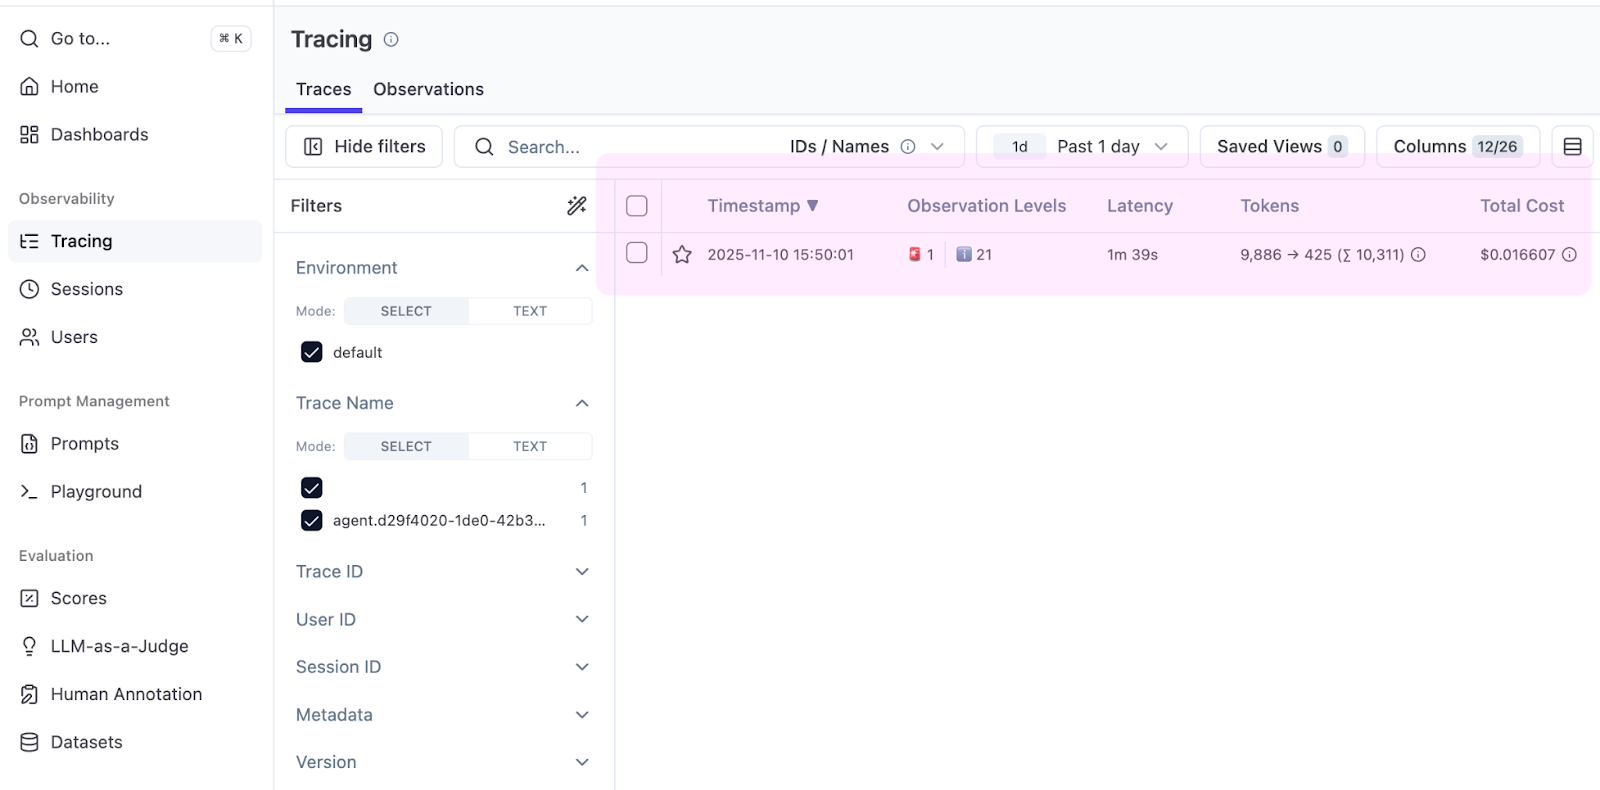
Immediately, the table displays something useful: the Total Cost column. Koog reports token counts, Langfuse applies pricing, and you can see that finding main() costs $0.016.
Open the trace to see the full run.
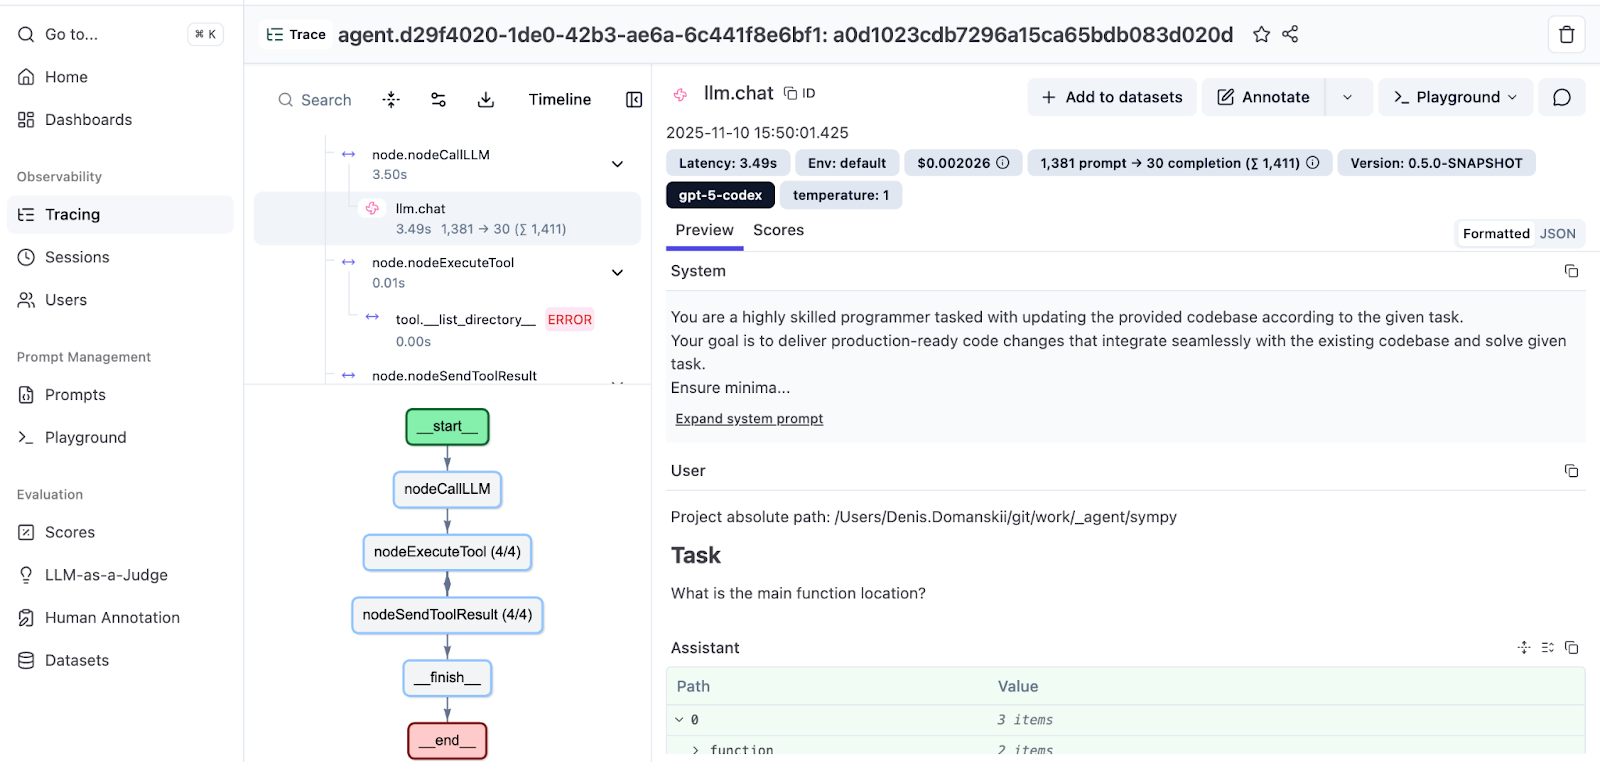
The left-hand panel shows your agent’s trajectory: messages, tool calls, and observations in order, with indentation indicating the call hierarchy. The right-hand panel displays details for each step: prompts, responses, tool parameters, and per-span cost breakdown.
At the bottom, you’ll also see an execution graph that visualizes the flow. For more details on Koog’s graph-based strategies, check out the documentation. You can also read a deep dive by the Koog tech lead: Mixing the Secret AI Sauce: How to Design a Flexible, Graph-Based Strategy in Koog.
Discovering issues through observability
While preparing examples for this article, we noticed a failed tool call highlighted in red.
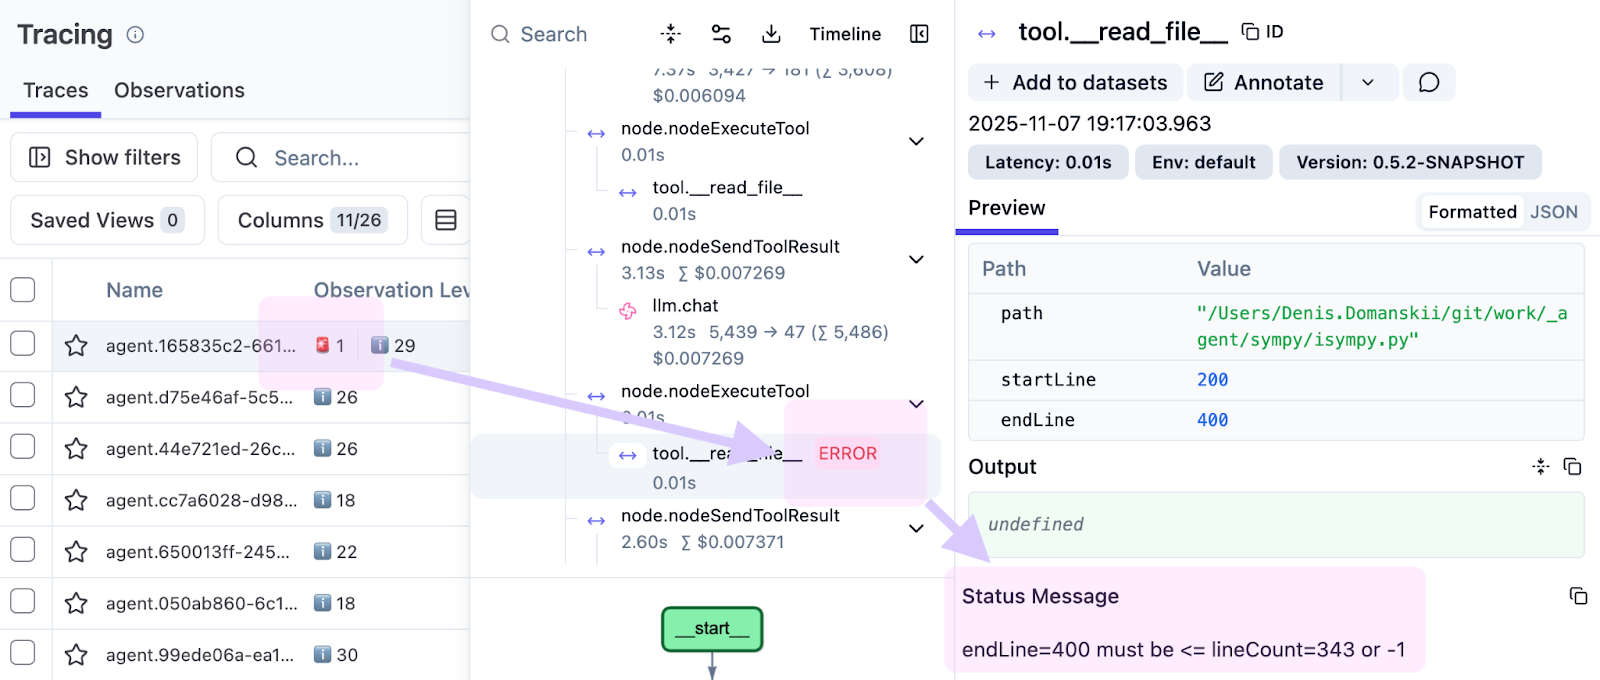
The observation was:
endLine=400 must be <= lineCount=394 or -1
The agent requested lines 0–400, but the file had only 394 lines. This points to a limitation in our tool implementation. Instead of failing, it should clamp the range and return the available lines (0–394), allowing the agent to continue. Without traces, this kind of issue often gets buried in logs. With traces, you see it in the exact run, at the exact step, and with the exact input.
That’s why observability matters. It shows not just that something failed, but also how and why, which makes fixes much easier.
Working with evaluation runs
Single traces are great for debugging, but evaluation runs need a batch view.
When you run your agent across multiple SWE-bench Verified tasks (a standard benchmark for coding agents), you want grouped traces and aggregated cost.
Langfuse supports this through sessions. Add a session ID as a trace attribute:
install(OpenTelemetry) {
    setVerbose(true)
    addLangfuseExporter(
        traceAttributes = listOf(
            CustomAttribute("langfuse.session.id", "eval-run-1"),
        )
    )
}
With this configuration, traces from the evaluation share a session ID. In Langfuse, navigate to the Sessions tab to see aggregate duration and total cost.
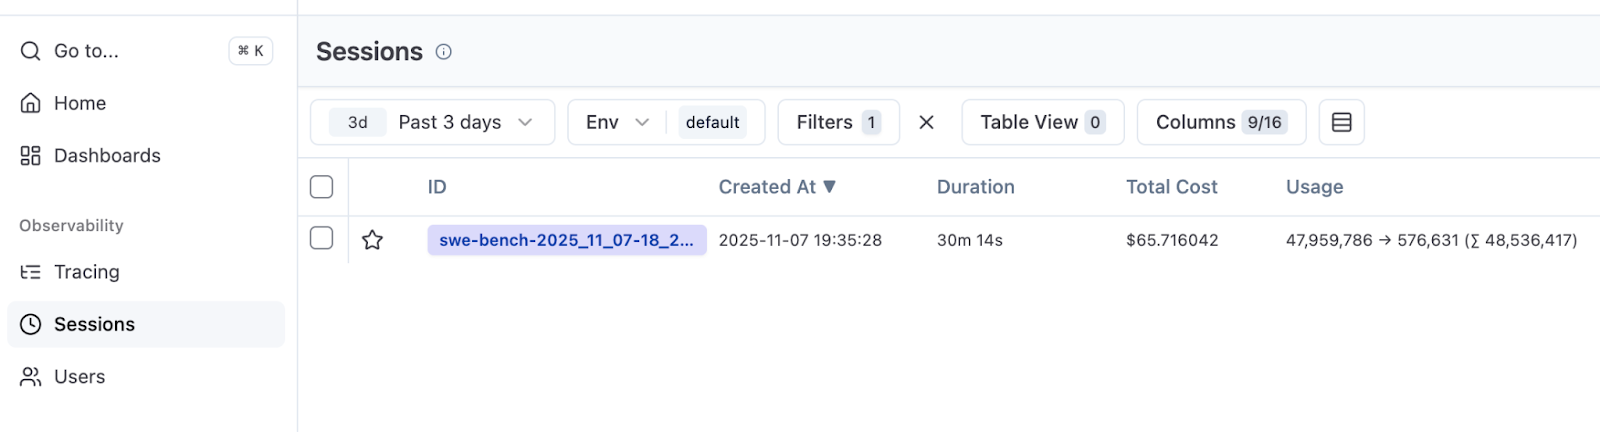
In our run, we executed 50 SWE-bench Verified tasks (out of 500). With ten parallel instances, the run took 30 minutes and cost $66. This gives a baseline for future experiments: success rate, runtime, and cost.
Langfuse doesn’t show success scores by default. That’s expected. Tracing records what happened, not whether a run passed. If you want success metrics in Langfuse, your evaluation harness needs to score each attempt and report custom scores. It’s worth implementing if you have the supporting infrastructure.
Looking ahead
Observability isn’t just about debugging. It’s also how you learn about the agent’s behavior.
With a few lines of code, we turned the agent from a black box into something you can inspect. We caught that line-range error that would likely have gone unnoticed. We learned that our 50-task evaluation costs $66. And we can now see which tasks consume tokens and which run efficiently.
In the next article, we’ll introduce a sub-agent pattern: Delegate specific tasks to smaller, cheaper models. With traces in place, you can decide what to delegate based on what the agent does in each run. No more guessing.
Resources
- Complete code for this article
- Koog OpenTelemetry documentation
- Koog Langfuse integration
- Langfuse OpenTelemetry support
Thank you for reading! I’d be happy to hear about your own approaches to trace analysis – what patterns have you spotted in your agents’ behavior? What surprised you? Feel free to share your experience in the comments!