More power to debug: Attach to local process
Hi,
With the recent 1.5 EAP build we’ve announced a new feature called Attach to local process. Let’s take a closer look at it.
In general, you can find the information about debugging in CLion in the corresponding blog post, it also includes a short demo. So in case you are interested in various breakpoints types supported in CLion, built-in debugger UI, ways to evaluate and view variables, please, refer to the post to learn the details. These topics are also covered in our webhelp in details.
Since the first CLion Public Early Access preview build we’ve been getting questions on remote toolchains support, including remote debugging. To make the very first step in that direction we’ve started with attaching to local process functionality. In a nutshell, it allows you to debug processes, run on the same machine as CLion, by attaching to them using their pid or process name.
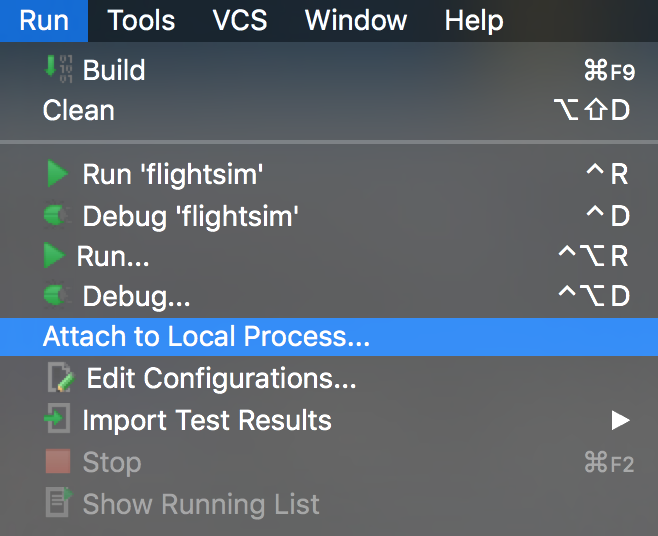
Currently in CLion attach to local process is available for GDB on Linux and Windows and LLDB on OS X (so not available for GDB on OS X). You can find the corresponding action in the Run menu of the IDE:
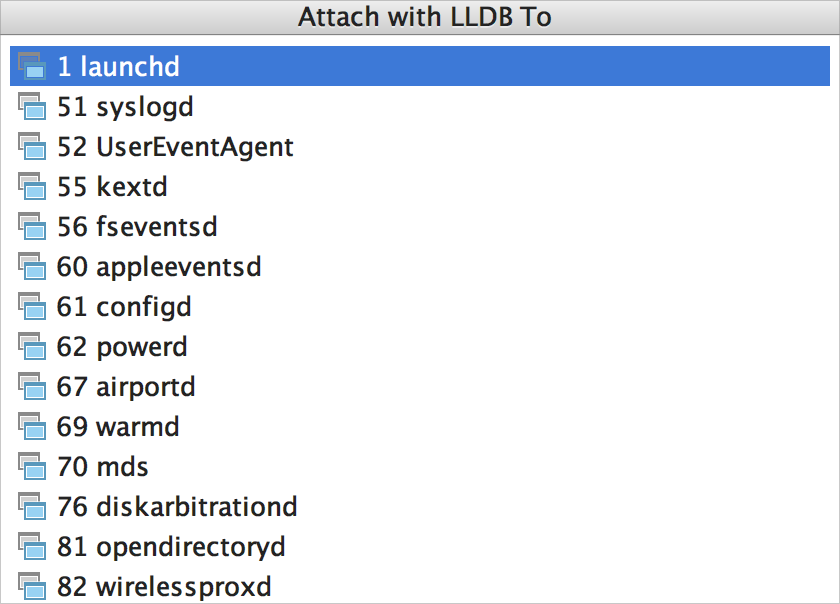
or call it via Find Action dialog (Shift+Ctrl+A
on Linux/Windows, ⇧⌘A
on OS X). All the processes will be listed in the dialog (Rem. Please, mind two problems we are currently aware of here – IDEA-150592 and IDEA-150591):
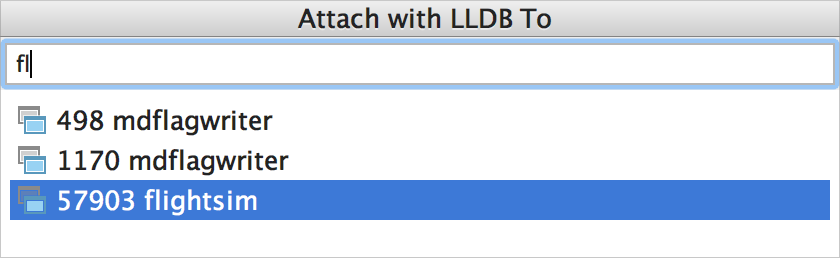
To simplify the search, just start typing either the name of the process:
or its pid:
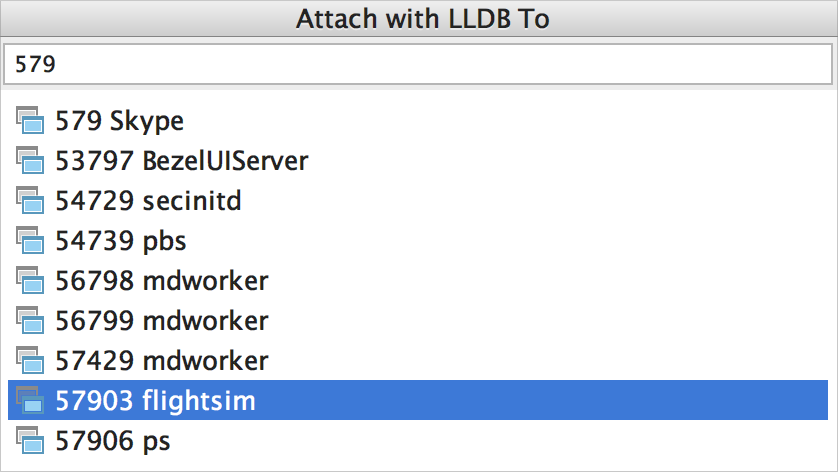
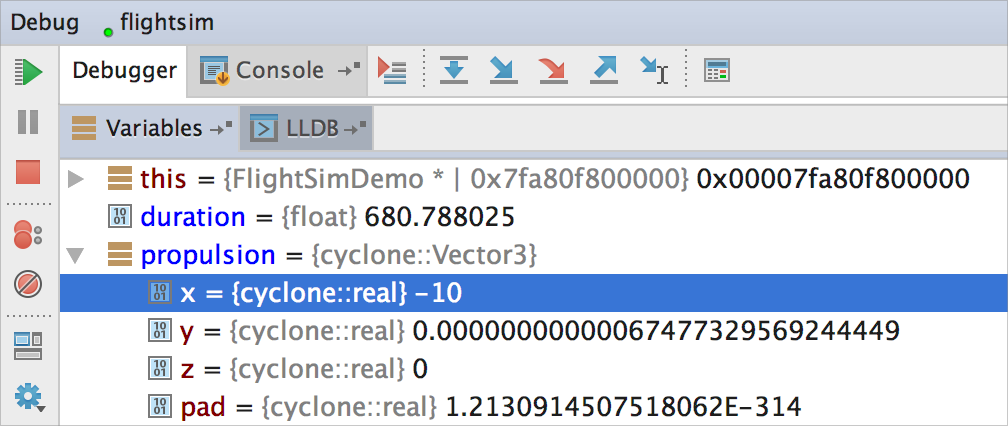
Select process to attach with CLion and now you can debug it with all the usual staff available in the IDE, including breakpoints, stepping, variable views, etc.
To detach click the ‘Stop the process’ button in the debugger toolwindow in the IDE (we’ll make the name more accurate in the later builds, since currently it detaches and doesn’t stop the process of course – CPP-5629).
Upd. Find the prerequisites for Ubuntu users in our webhelp.
In the end, let us also share feature requests related to the topic that you can find interesting. Feel free to leave comments, upvote and share your personal use cases (they really help us to figure out the proper implementation and UI, so thank you in advance!):
- Debug forked child processes (CPP-955).
- Debug arbitrary binary (CPP-1313).
- Attach to Existing Process: add re-run button (OC-3352).
- Remote debug (CPP-5539).
That’s it! Download the build and give it a try.
Sincerely yours,
The CLion Team
Thomas Watt says:
January 24, 2016So close – please keep developing this feature!
Our company is doing remote gdb debugging for ARM embedded development and we would really like to use CLion as the IDE.
We are using the standard gcc toolchain (arm-none-eabi-gcc) and then OpenOCD to open a session to talk to the debug probe connected to the target hardware board. Then using arm-none-eabi-gdb -tui ./target/firmware.elf followed by target remote localhost:3333.
I was hoping with this EAP 1.5 release that we could finally get rid of that ‘-tui’ and use a real IDE for debugging instead of the text ui. Sadly we are mostly on Mac OSX and this release didn’t quite get support for attach to local GDB process on Mac.
Soooo looking forward to trying it.
Anastasia Kazakova says:
January 24, 2016Many thanks for describing the use case. We’ll keep it in mind!
Landon Cox says:
March 31, 2016I have this exact need as well – CLion could take the ARM development market by storm with this feature. Most of the IDEs for ARM (IAR, Eclipse, etc) are substandard comparatively.
Anastasia Kazakova says:
March 31, 2016Stay tuned. We do plan attach to remote process for 2016.2
Torbjørn says:
June 28, 2016+1
Working with a vendor-supplied ZigBee stack, I’m forced to use IAR (TI, I’m looking at you! >.>). Luckily I found a plugin that allows me to work in Eclipse while using the IAR compiler, linker and debugging support, but it’s still not the same as CLion/IntelliJ…
If I could work in CLion (with the same integration), I would switch immediately – Eclipse isn’t even anywhere close to the autocompletion and usability of CLion. Please make it happen!
Eugene says:
January 29, 2016So when I attach to node process running my c++ module on Mac, my breakpoints never hit. Any ideas? Tried to switch to GDB toolchain: no effect… Can you make up an example of debugging node modules? That would be the most valuable function to CLion.
Anastasia Kazakova says:
January 29, 2016First, pay attention that attach to local process is not available for GDB on OS X, only with LLDB.
Could you also comment on ‘node process running my c++ module’ – what exactly do you mean? nodejs?
Eugene says:
March 21, 2017sorry for the confusion, I’m developing c++ code in Linux and using Clion bundled 7.11.1 gdb. I have a service running and I want to attach to it and do debug, it can attach to the process but break point won’t stop.
Eldar Abusalimov says:
March 23, 2017Apologies for the late response. Is it possible, by chance, that the executable you attach to doesn’t have debug symbols? How exactly do you build a module? Is it just a shared library loaded by node.js at runtime or something else?
Pavel Odintsov says:
March 5, 2016Hello, folks!
Thanks for nice job! But actually I could not use Clion because I’m working on Mac OS X but my project need so much Linux staff (kernel modules and ~20 custom linux-only libraries) 🙁
So I’m working with remote folder mounted on my dev laptop. But actually I could not find any way to call cmake over ssh instead of local run. I have complete build environment on remote server but I need some way to override build command 🙂
Anastasia Kazakova says:
March 6, 2016Unfortunately, remote work is not supported yet. It should be done within this task: https://youtrack.jetbrains.com/issue/CPP-744 – follow to get the updates or/and leave comments.
Eugene says:
March 21, 2017Clion cannot stop at break point when attach to running process in Ubuntu14:
I did attach to process but it won’t stop at the break points, any ideas on it? I’m using bundled gdb and it used to work on ubuntu12 but after upgrade to 14 it stops to work. Gdb is correctly attached to the process but breakpoint is not working…
Thanks
Eldar Abusalimov says:
March 23, 2017Eugene, could you enable debug logging as described here: https://intellij-support.jetbrains.com/hc/en-us/articles/206560589-Debugger-doesn-t-stop-on-a-breakpoint-Debugger-shows-Command-timed-out-What-to-do-, then reproduce the problem and send the logs collected either through our support channel or anyhow it is convenient for you? We’ll investigate.
GK says:
February 10, 2020It’s 2020 now and I am still having Eugene’s issue in CLion which is stopping me from using CLion as a real “IDE”. Back to good old emacs! Any suggestions to resolve will be hugely appreciated.
Anastasia Kazakova says:
February 10, 2020Could you please collect logs and described above and share with us?
Jan Schauta says:
March 20, 2018Great feature!
It would be nice though to add “Attache to local process” template to Run/Debug configurations. To attach process through some pattern.
Then it could be just one Shift+F9 to build->run->attach->debug.
Anastasia Kazakova says:
March 20, 2018Interesting idea. Thanks
fatfatson says:
May 14, 2020still not implemented…
Anastasia Kazakova says:
May 14, 2020Please follow this request for the updates: https://youtrack.jetbrains.com/issue/CPP-9811
Danilo Silva says:
December 21, 2018This is feature is very nice. Thanks for that. Is there any chance of having some integration with pytest? I mean, when I’m debugging a test that uses a python binding for C++, I always need to check the python PID from the execution console and then I need to manually attach that. This is very time consuming as we do that all the time and to have something to make this process automatic would be very great.
If you need more details about this workflow (which is very common for scientific stuff), please, let me know. I will be glad to help.
Thank you!
Anastasia Kazakova says:
December 21, 2018Am I right that you debug your C++ code and would like to jump to the Python code during debug automatically?
Danilo Silva says:
December 21, 2018Actually, I do the oposite. I run python tests that calls C++ code. I have to set breakpoints on both python and C++, because I need to know python PID before attaching to GDB. I wish I could have a way of jumping to C++ without this trick.
Anastasia Kazakova says:
December 21, 2018Yes, this requires a cross-language debugger which is currently under development. So some time in future you can expect it in CLion.
Danilo Silva says:
December 21, 2018Well, I understand that this would be much more robust. But currently, If you at least provide me a marker on processes that were started by clion (in my Case, pytest runner), it would help me a lot.
Anastasia Kazakova says:
December 24, 2018Ok, thanks for the suggestion. Where and how do you want to see this marker?
Danilo Silva says:
January 9, 2019Oh, sorry for the delay. Just after you enter “Attach to Process…” they are currently ordered by PID. If you put the python process started by clion at first or at least put it another color (or with some extra label, I don’t know what fits better) that will be enough to skip the process of manually discovering its PID. I currently can filter by the name of the process (python), but generally my system have more than one with same name.
Thank you for replying.
Anastasia Kazakova says:
January 10, 2019Ok, got the use case, we need to think about it. Not sure we can easily detect the origin of the system processes.
Danilo Silva says:
January 10, 2019Thank you very much in advance
Anastasia Kazakova says:
January 10, 2019You can follow this request: https://youtrack.jetbrains.com/issue/CPP-15098
Stefan says:
March 5, 2020Would it be possible to make CLion’s interactive (gdb-based) debugger to attach to Java processes, which forks other C++ based processes, and hit breakpoints into the C++ code of those child processes?
I find it tedious to have to manually attach to those child C++ processes, and I miss the startup part of the c++ code.
Thank you.