CLion 2017.3 EAP: Valgrind memcheck integration

Hi,
Today we are rolling out a new CLion 2017.3 EAP build (173.3415.24) with support for memory check from Valgrind and some polishing of the toolchains rework.

Valgrind: memcheck
Good news everyone! CLion now comes with Memcheck integration; this means you can detect runtime errors and memory leaks right from the IDE. We know you are eager to try it out on your project, but first let me put a few general thoughts down here:
- This is just a first step toward the support of profiling tools in CLion
- Memcheck is just one member of the big Valgrind family, but probably the most famous (and used) one
- Valgrind doesn’t require a program recompilation and supports both GCC and Clang
- There are dozens of great tools available to C and C++ developers other than Valgrind, like Google sanitizers, and gprof. If you are interested in any of these, feel free to upvote existing requests or fill out a new one in our tracker.
System requirements & settings
Valgrind works on Linux and macOS and is available in CLion on both of these platforms. CLion detects it automatically by searching for it in the standard locations defined by the system PATH variable. Or you can point CLion to Valgrind’s executable using: Settings/Preferences | Build, Execution, Deployment | Valgrind:
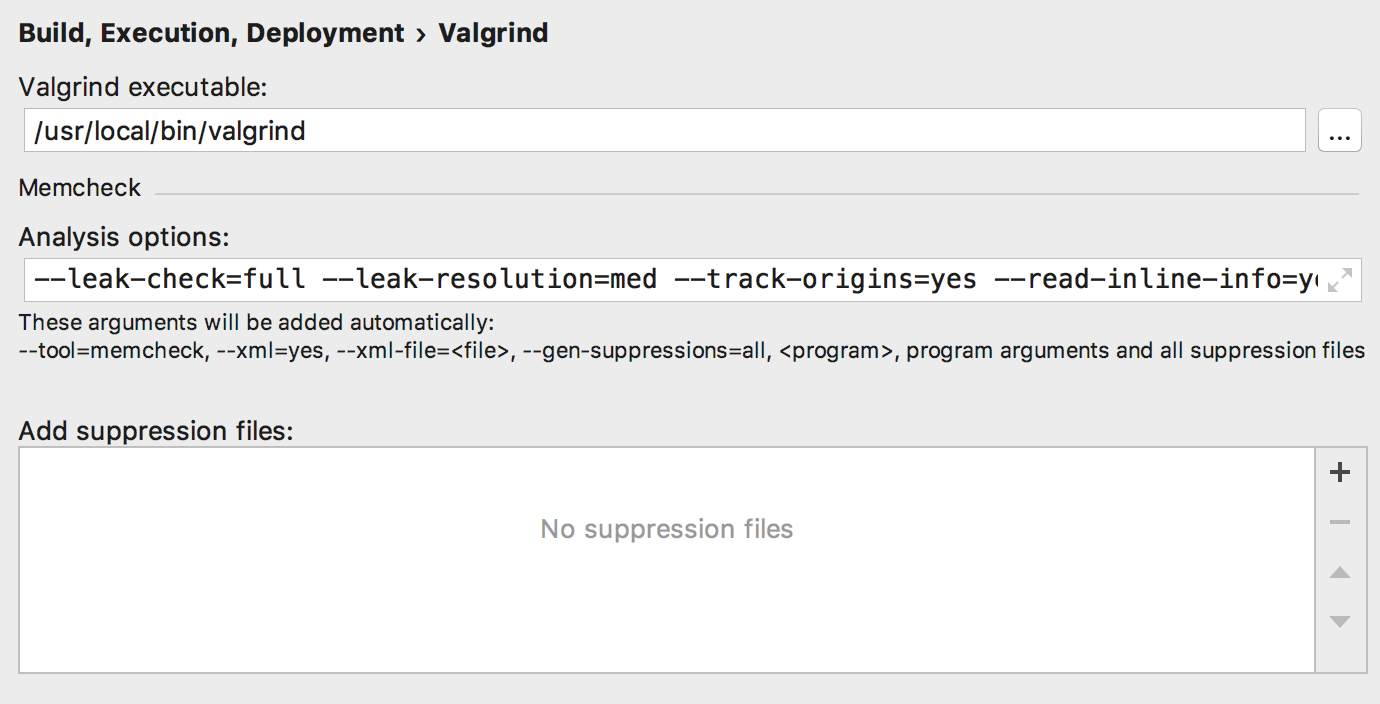
Options with which to run Valgrind and a list of suppression files which can be used, can also be configured on this page. For example, you may want to add a non-default suppression file to turn off Valgrind checks on some particular libraries you are using in your project. The typical case here, for example, would normally be to suppress OpenSSL or Boost.
Default Valgrind options include:
--read-inline-info=yeswhich is supported in Valgrind 3.10.0+, so if you have an earlier version remove this parameter--read-var-info=yeswhich causes issues on macOS platform, so remove it in this case
Running targets under Valgrind
Select a Run/Debug configuration and run it under Valgrind memcheck via the Run | Run Valgrind Memcheck… or special icon in the Navigation bar located next to the Run and Debug options:
![]()
This icon is present on all three platforms, but it is disabled on Windows as Valgrind is not available there.
You’ll get a new tab called ‘Valgrind’ in the Run toolwindow. It provides the information about all the possible errors found by Valgrind, along with the source code location (use F4 on Linux and ⌘↓ on macOS to Jump to Source) and a stack trace. The results are grouped by the type of leak encountered:
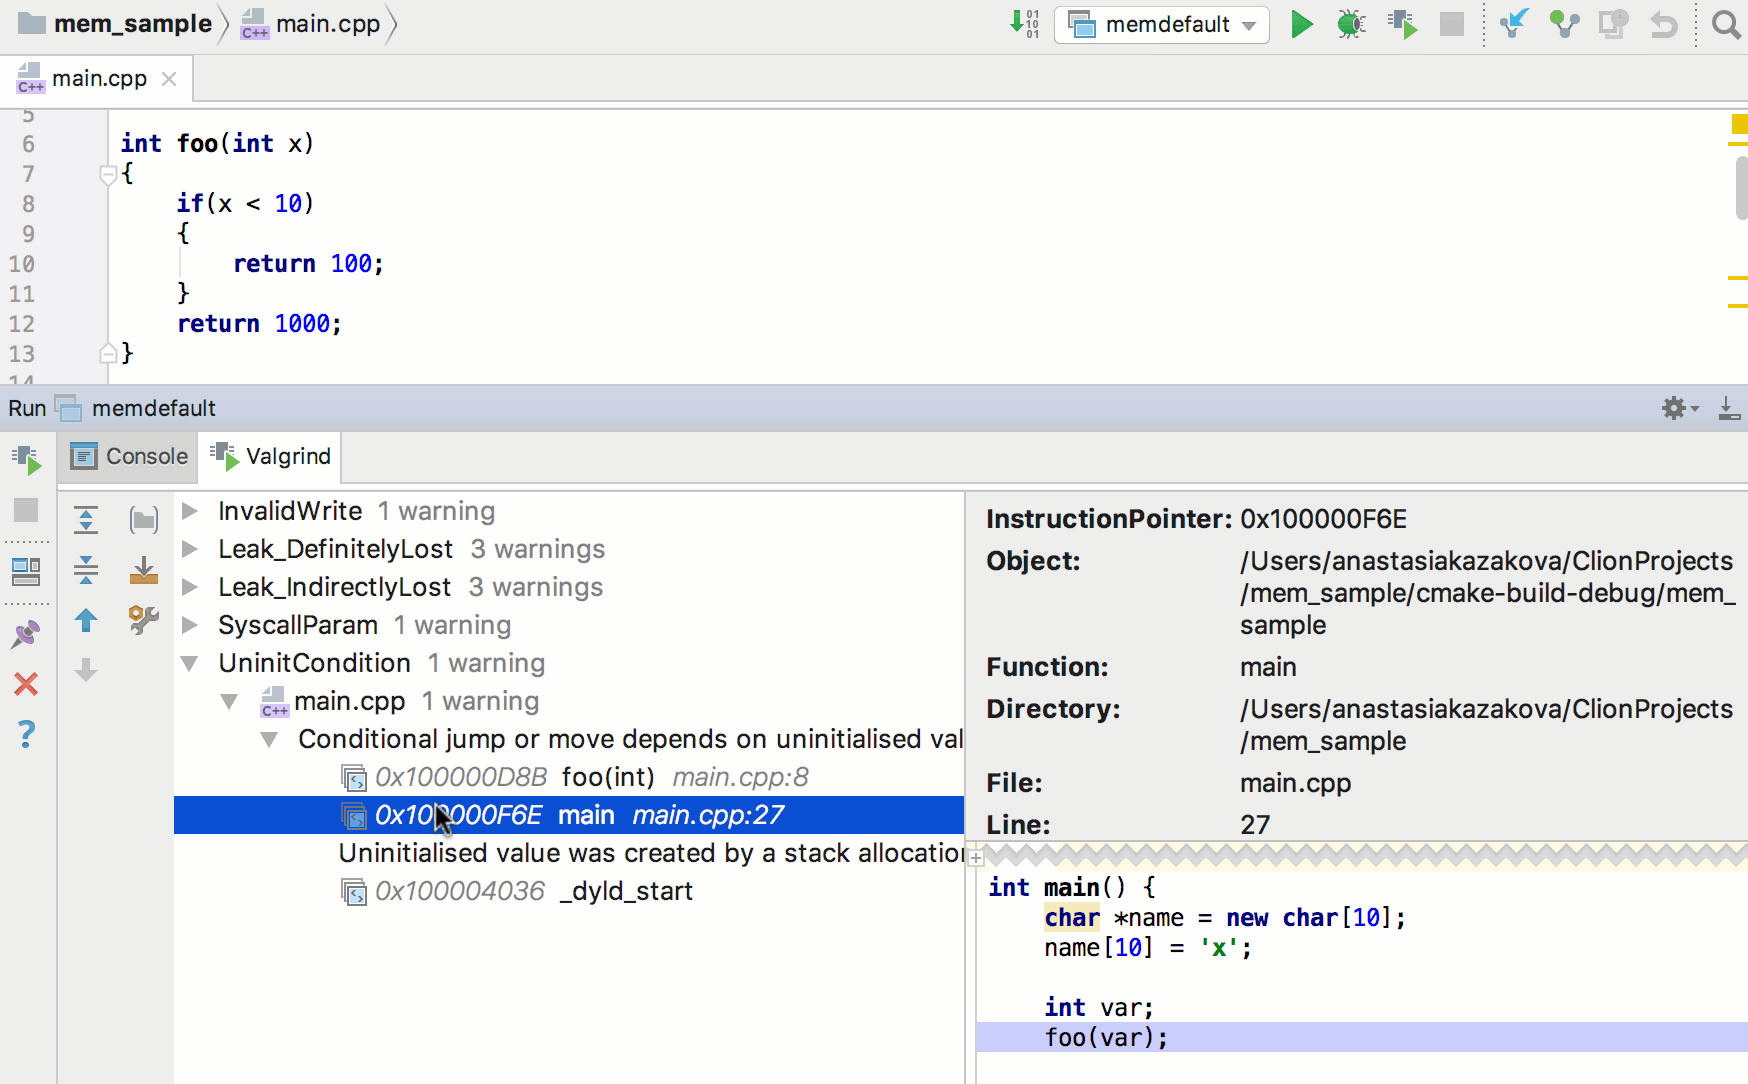
In the context menu on a particular error you can:
- Exclude the error from the current results log, error will be back on the next Valgrind run
- Suppress the function that causes an error by adding a corresponding record to the selected suppression file
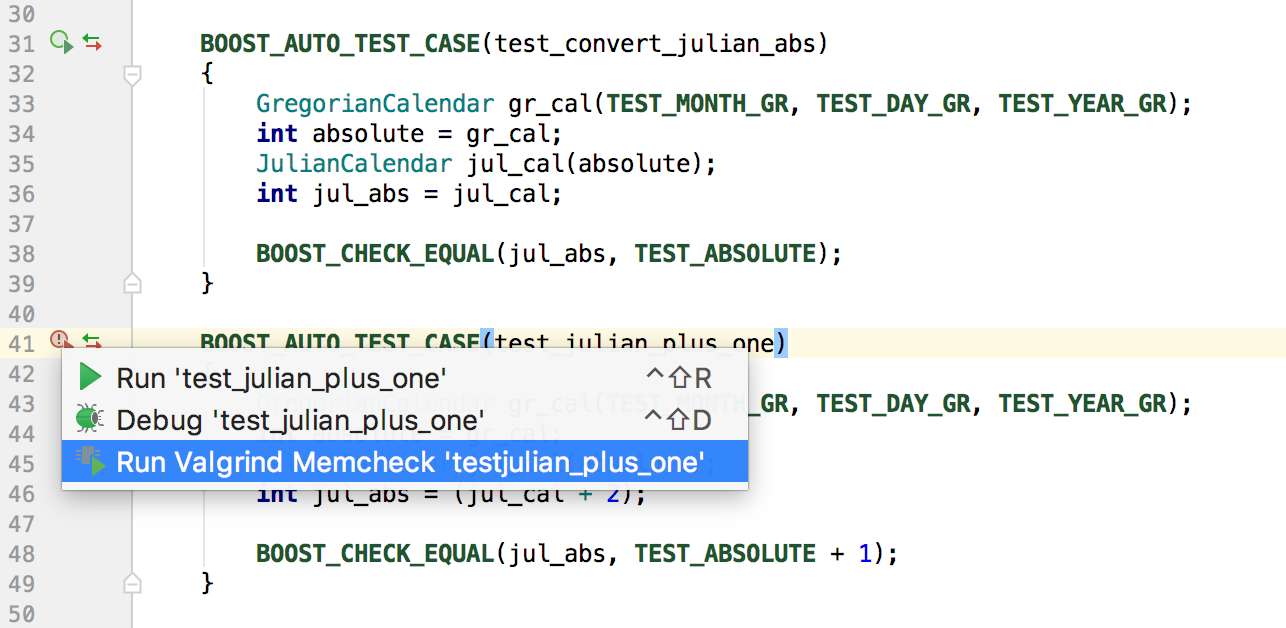
Running tests under Valgrind
Google Test, Catch and Boost.Test targets can also be run with memcheck. You can either select necessary test target and press ‘Run Valgrind Memcheck’ icon in the Navigation bar, or use test icons in the left gutter when the file with tests is opened in the editor:
Check out the memcheck (Valgrind) integration into CLion and let us know what you think! Mind, UI is not final yet, so your feedback here is appreciated.
Toolchains, CMake profiles & more
Multiple toolchains support was brought in with CLion 2017.3 EAP which allowed:
- easier compilers configuration
- different CMake versions/debugger for different projects and configurations
- on Windows different toolchains (MinGW, Cygwin or Microsoft Visual C++) for different projects and configurations
This EAP build polishes these changes and allows you to get several CMake profiles with the same build type. For example, you can use it if you want to build different Debug targets in your project with different toolchains. In previous CLion versions, you have to switch the toolchain in the CMake profile that corresponds to the Debug build type. Now you can configure several such profiles:
- In Settings/Preferences | Build, Execution, Deployment | Toolchains create several toolchains:
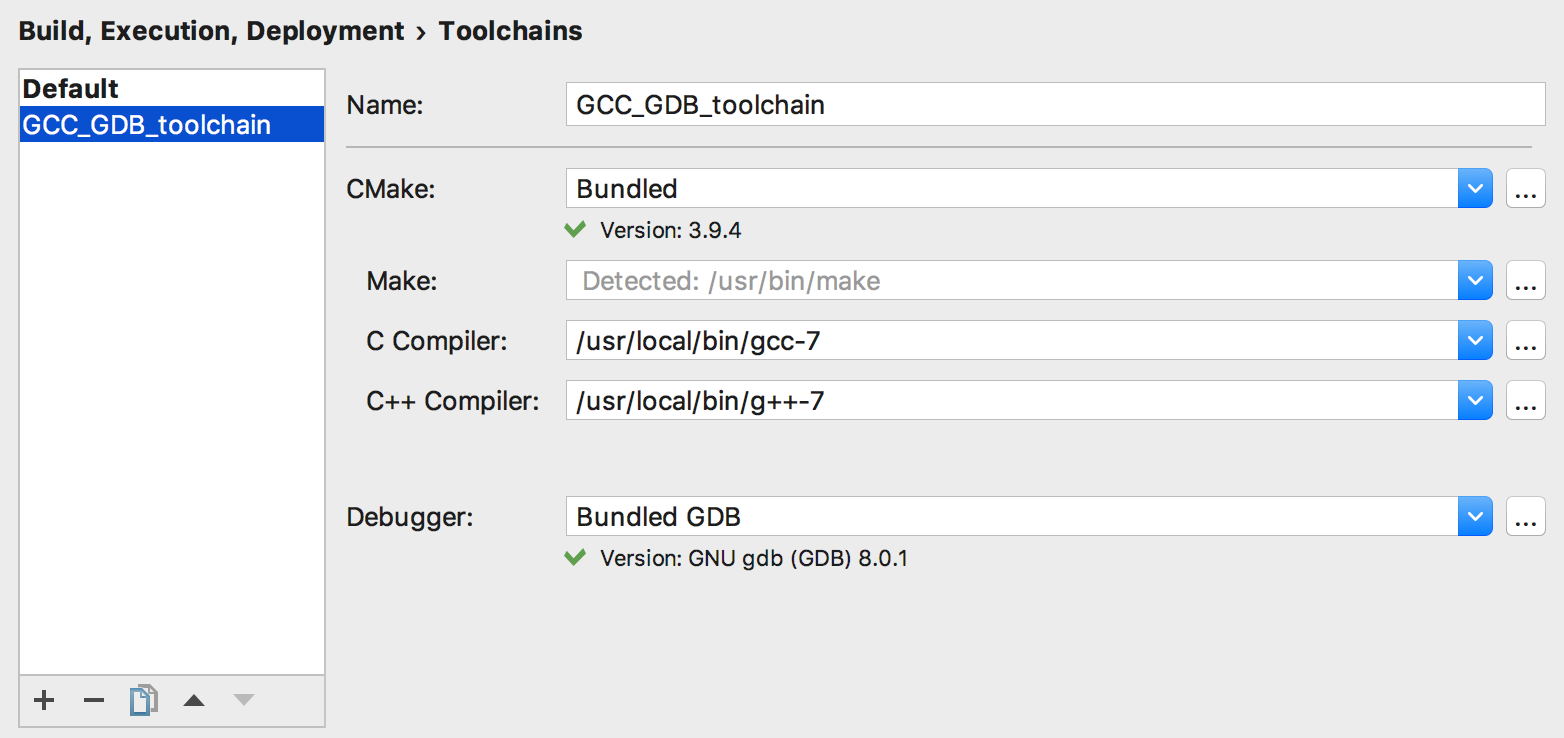
- In Settings/Preferences | Build, Execution, Deployment | CMake add several CMake profiles which use different toolchains:
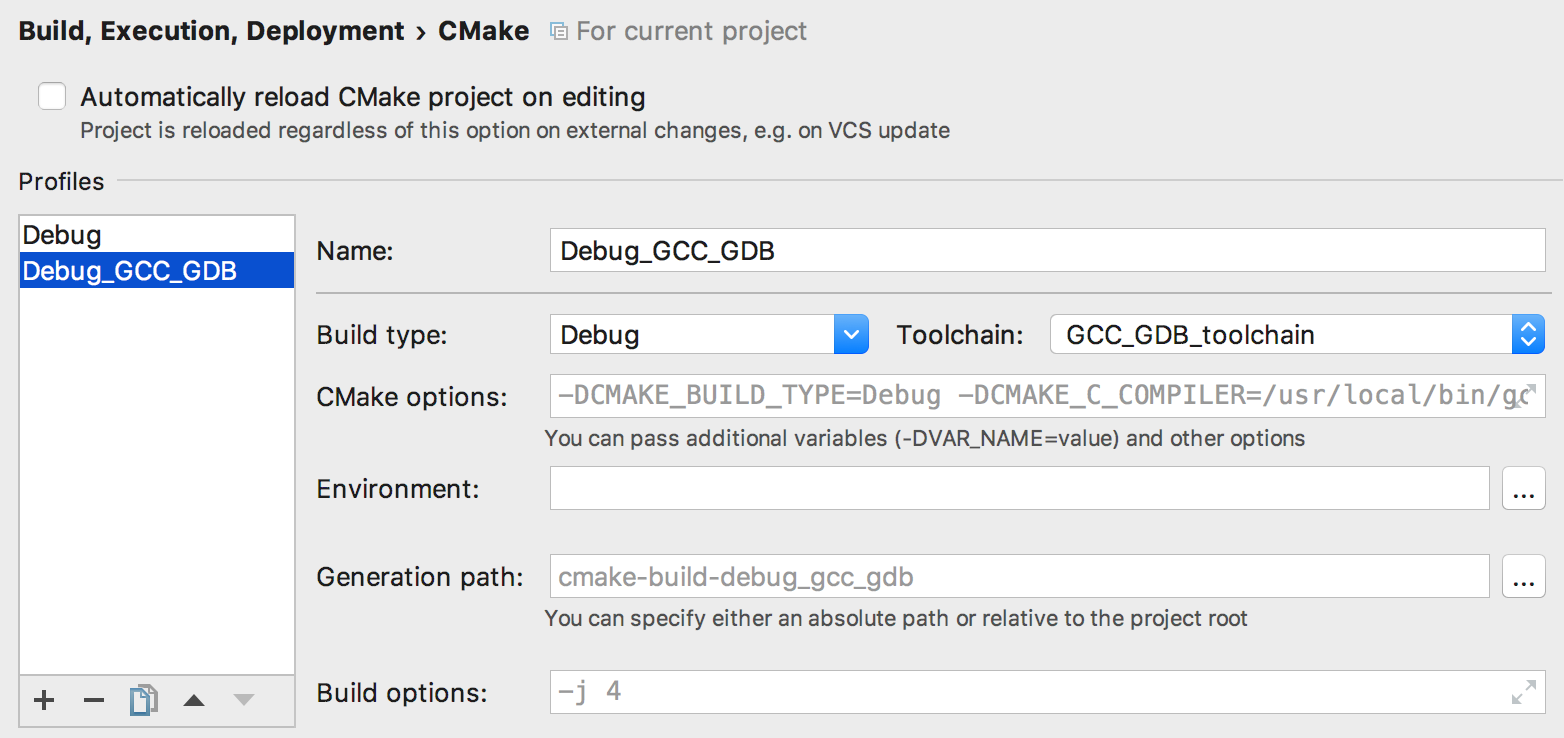
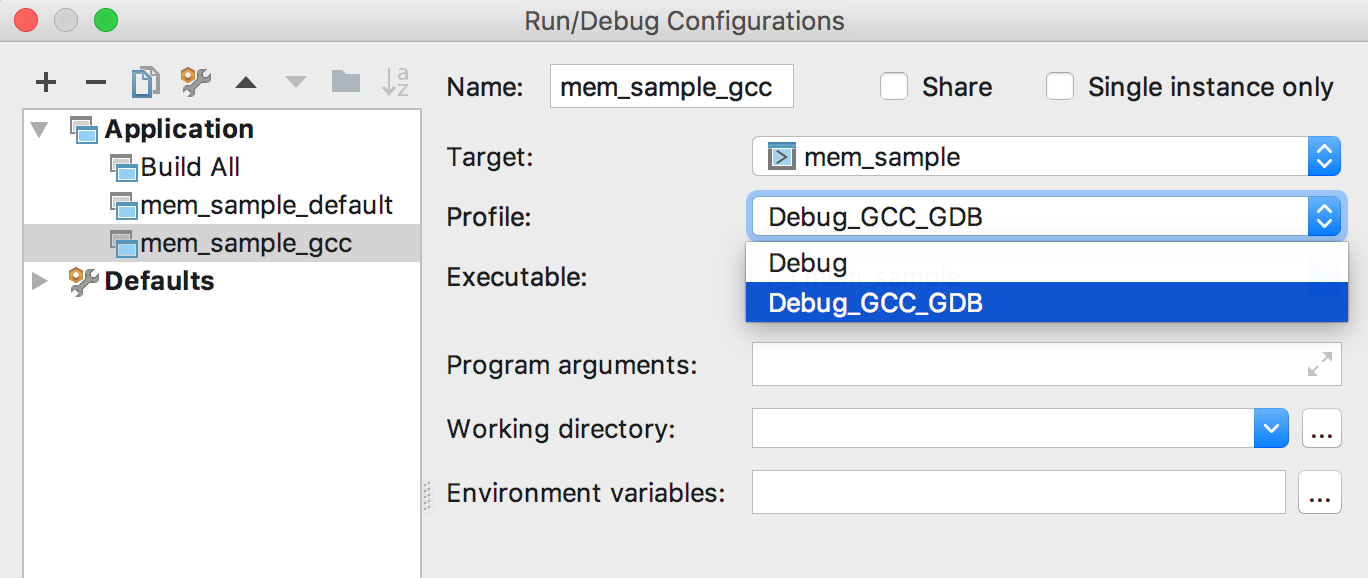
Profile names should be unique. Default CMake generation path will be cmake-build-. Build options are now specified per CMake profile. - Create several Run/Debug configurations with different CMake profiles:
That’s it! Full release notes can be found here.
Your CLion Team
The Drive to Develop