CLion 2018.3 released: remote development, CPU profilers, C++17, clangd-based navigation, and VCS and editor improvements
This year we’ve focused on two areas to enhance CLion. The first is better C++ language support and general IDE performance improvements. As a result, we’ve added a clangd-based experimental complementary language engine, and a massive amount of work was done which, although invisible at first glance, has helped eliminate dozens of UI freezes in the editor.
The second area is the endless world of remote configurations. Starting with Windows Subsystem for Linux (WSL), by the end of the year it has evolved into full remote development support.
Our efforts in both of these areas have culminated in this year’s final major release which is CLion 2018.3. Let’s look at all the goodies it brings with it in more detail!

2018.3 gathers the following changes under one roof:
- Initial remote development support.
- Integration with CPU Profilers on Linux and macOS.
- C++ support
- Improved editor performance when unit-testing.
- New and updated IDE actions: Build/Rebuild, Run Anything, and Search Everywhere.
- Inspections of scheme compliance for compilation database.
- VCS enhancements: support for Git submodules and GitHub pull requests.
- Editor improvements: multiline TODO, formatted macro expansion, accessibility enhancements, and a new UI for plugins.
- Updates to Rust and Swift plugins.
Grab your free 30-day trial of CLion to evaluate the new features and improvements. Check them out in this quick demo from Phil Nash, or read on for more details:
Remote development
You can now develop remotely from a Windows, Linux, or macOS client machine to a Linux remote host. Note there are two major constraints to the configuration for now:
- It works only for CMake-based projects (CLion also supports Gradle and compilation database project model, but remote development for them is not yet supported).
- The setup assumes the source code is located on a local machine, which CLion synchronizes using
rsync(on macOS and Linux) orsftpandgzipcompression (on Windows) to the remote machine. In return, CLion synchronizes the header search paths to the local machine, in order to perform code resolve quicker and keep the editor more responsive while you work with the code.
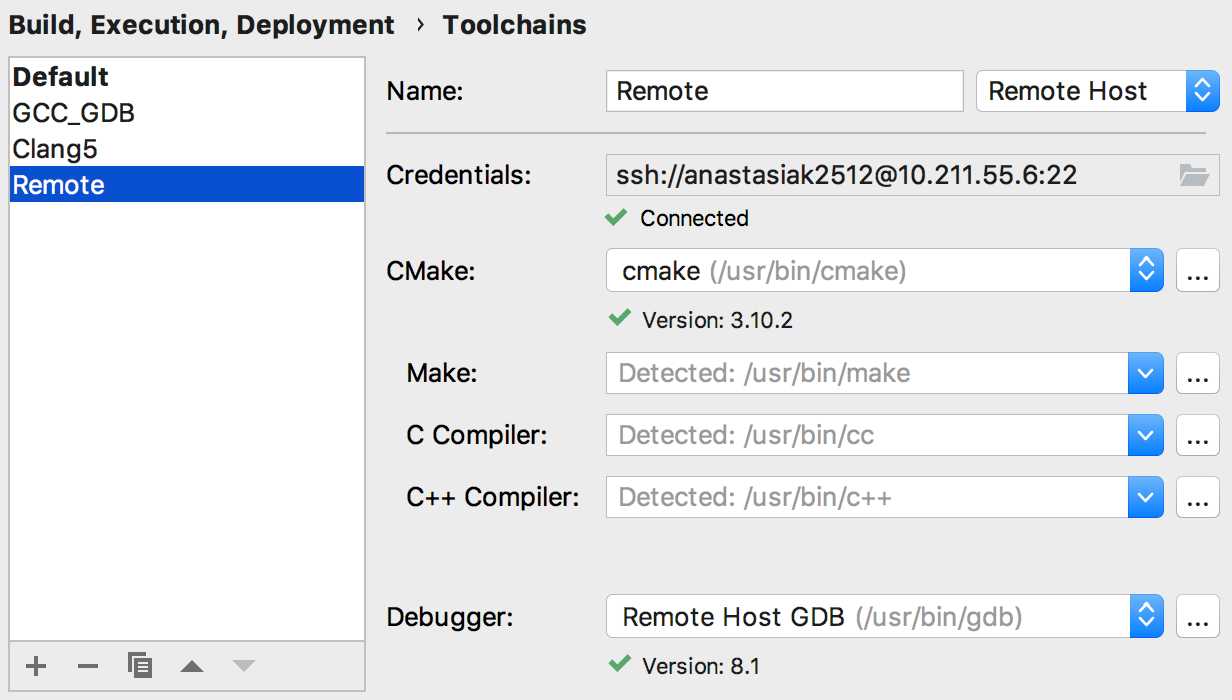
The configuration is pretty simple – just create a remote toolchain in Settings/Preferences | Build, Execution, Deployment | Toolchains, and use it in the CMake profiles configured for the project (or make this remote toolchain the default one, to use it automatically):
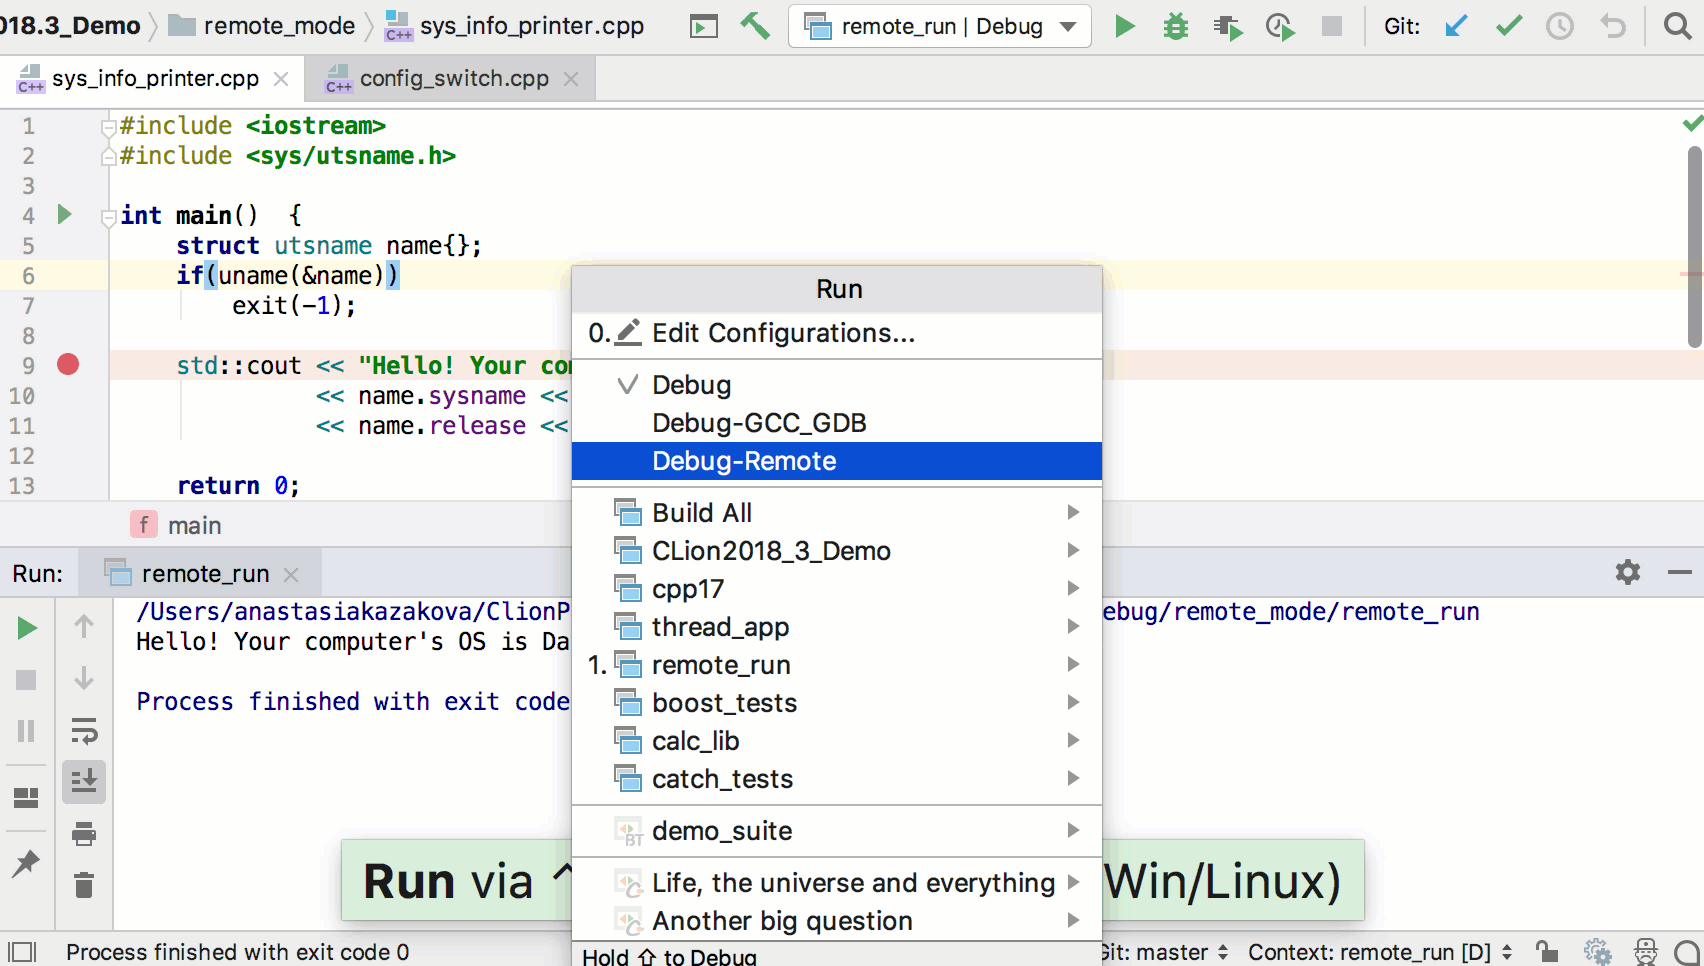
When this is done, you can compile, run, and debug your application or tests on a remote machine right from CLion. Invoke the commands as usual and have them executed remotely:
For more details on how the remote mode works under the hood, read our detailed blog post. Meanwhile, if you are interested in what we are going to concentrate on going forward, please visit our tracker:
- Open remote CMake project, so the sources are assumed to be stored remotely (CPP-14584)
- Remote version system control support (CPP-14482)
- Remote Terminal Support (CPP-14588)
- Integration with Valgrind Memcheck (CPP-14178), Google sanitizers (CPP-14179), and CPU profilers (CPP-14357) in the remote mode
- And other requests linked to the parent one on remote development (CPP-744)
CPU Profiler
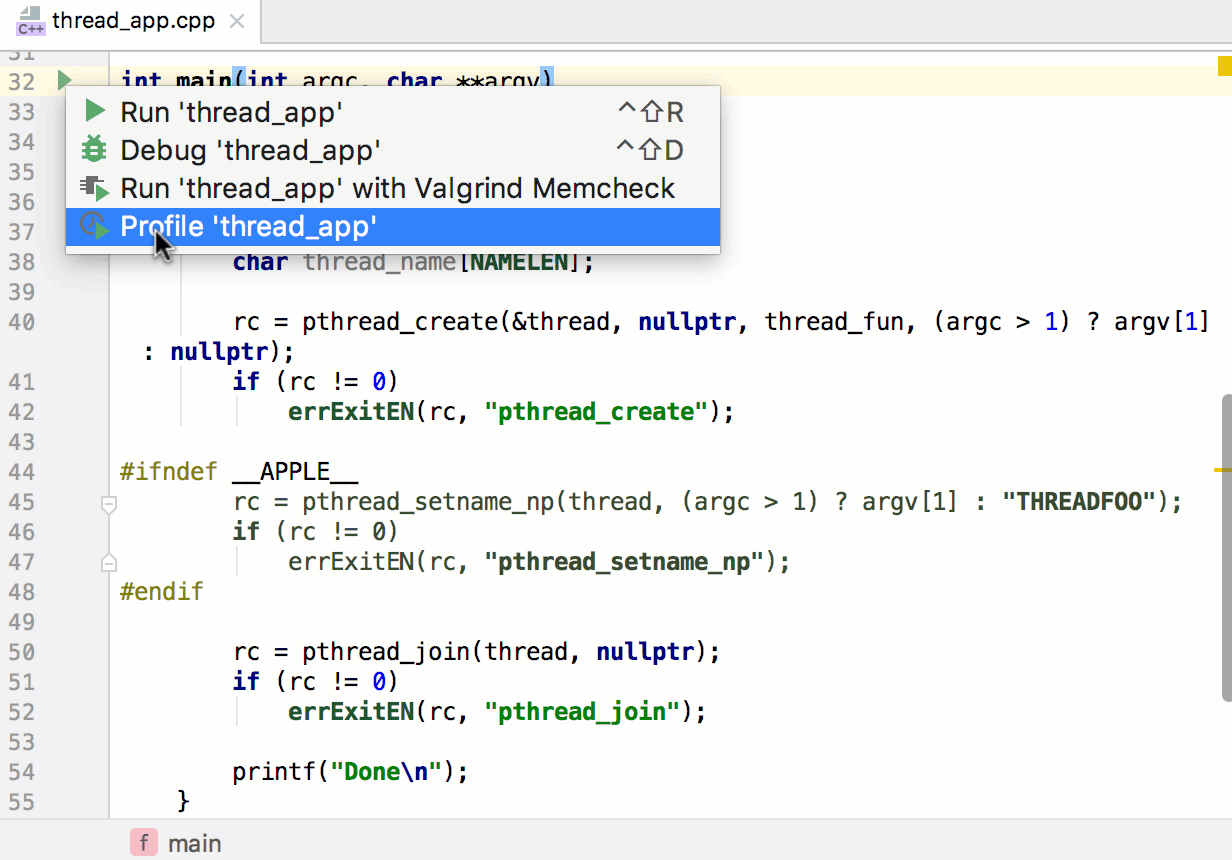
CLion now integrates with CPU Profiler on Linux (Perf) and macOS (DTrace). A new action for doing this is available in the navigation toolbar, as well as in the run menu that appears when you click the run icon in the left gutter.
It usually takes some time for the profiler to collect the data. When it’s finished, the notification balloon is shown and the information about the application performance analysis is available in the profiler tool window (View | Tool Windows | CPU Profiler). Tabs with the flame chart, call tree, and method lists provide the information divided by threads. Alternatively, you can see the information from all the threads merged, in one place. You can also jump to the source to explore the code that is causing the performance degradation in your app:
Would you like to see any other profilers integrated in CLion? Let us know!
C++ Support
Clangd-based engine: now for navigating through your code
One of our key goals is to make CLion accurate and knowledgeable about modern C++ language features. To inch closer to it, this year we’ve released a new complementary language engine based on Clangd, which works in parallel with CLion’s own language engine and helps with some particular editor features. In the current v2018.2, error and warning annotations were implemented based on Clangd.
In CLion 2018.3, some of the navigation and search actions have been moved to the Clangd-based engine, including Go to declaration/definition, highlighting references under the caret, the Quick Documentation Popup, and Find usages. The results we get from Clangd-based engine are still reviewed and adjusted by CLion, so the two engines still work in parallel to give you the most accurate and reasonable results.
To manage which CLion features are based on clangd, go to Settings/Preferences | Languages & Frameworks | C/C++ | Clangd:
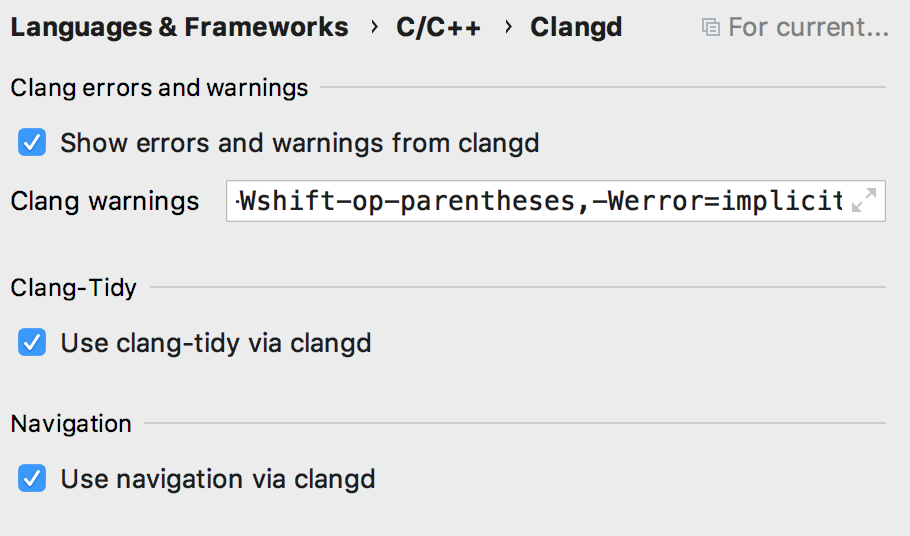
The error annotator, Clang-Tidy, and navigation via Clangd are all independent from each other, so you can configure a setup that works best for your projects. By default, Clangd is used for all three; to disable it completely, you have to turn off all three options.
By the way, Clang-Tidy (a famous C++ “linter” tool) is based on clang AST and is available in CLion with or without the Clangd-based engine. The main difference is that when enabled via Clangd, it uses the AST cached by Clangd, which improves performance.
C++17: support for fold expressions and deduction guides
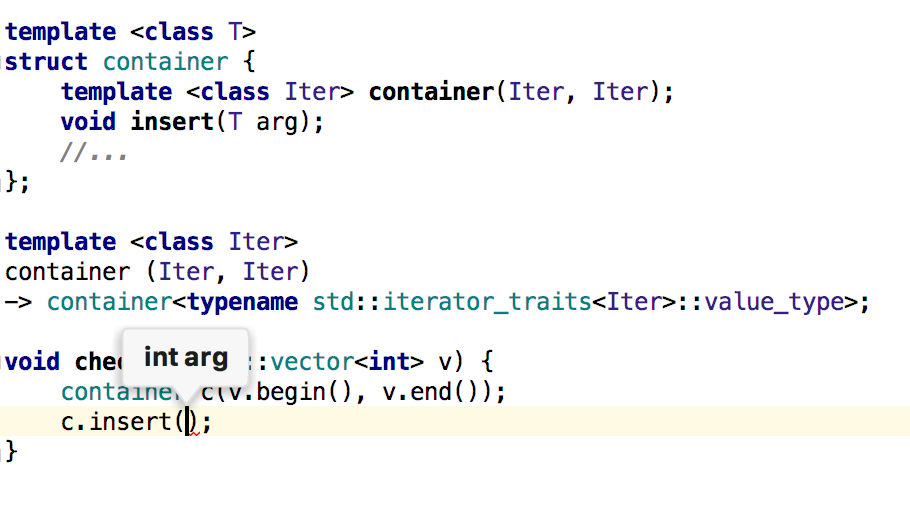
Although we are investing a lot of effort in implementing more IDE capabilities on top of the Clangd-based engine, we still continue improving CLion’s own language engine. As adoption of C++17 grows, we’ve added support for C++17 fold expressions and C++17 deduction guides to CLion’s parser. As a result, code highlighting has become more accurate and code assistance is now even better at understanding your code. For example, types can now be inferred correctly in case of user-defined deduction guides:
Unit-testing performance improvements
Improving the editor’s performance and eliminating UI freezes was a major area of focus for us in this release cycle. To improve performance, CLion now uses lazy test detection. This reduces project indexing times in many situations, regardless of which testing framework you use – Google Test, Boost.Test or Catch(2). We’ve already heard some very good feedback from our EAP users who said the editor is now much more responsive.
As CLion now detects unit tests in a lazy manner, we’ve added a special action for diagnostic purposes – “Show Test List”, available from the Find Action dialog. It opens a file with the list of all tests currently detected in the project:
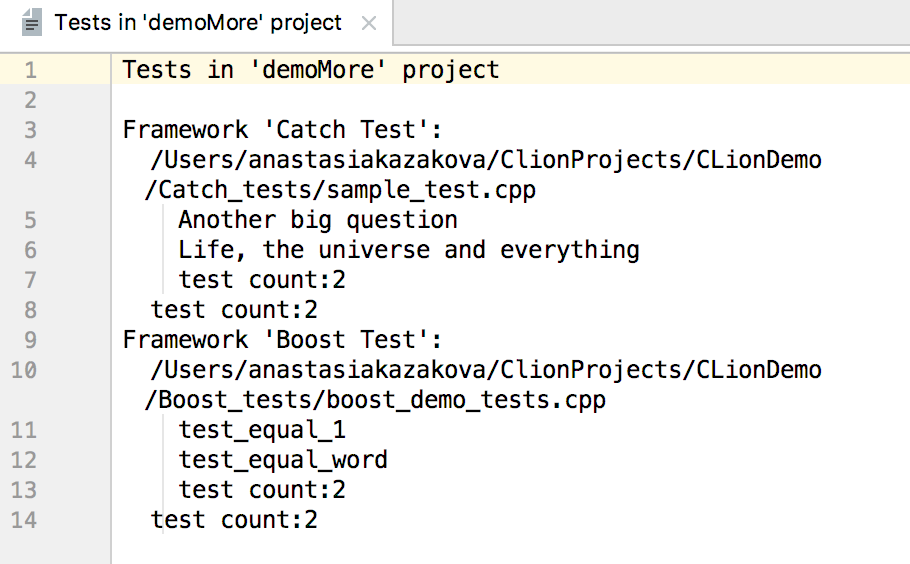
If you haven’t started any unit tests in your project or haven’t opened any files with the unit tests, you’ll probably get an empty list, as the action itself doesn’t trigger test indexing. But if you have, you’ll get an appropriate list and will be able to check which tests you’ve actually indexed in the project. If you have ideas on how to improve this feature, please share them with us!
New and updated IDE actions
Build/Rebuild
CLion v2018.3 introduces a new Build menu, which gathers all the build/rebuild/install actions available for a particular project model. For compilation database, it’s only Recompile for a single file. But for CMake, there’s much more:
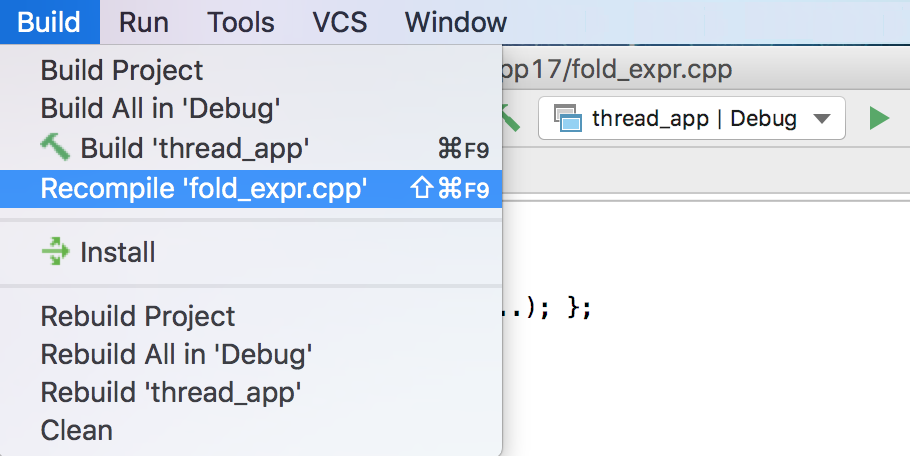
For example, ‘Build Project’ is a new action which builds CMake all target from all CMake Profiles configured for the current project. To build all target from the particular CMake Profile, use ‘Build All in <selected CMake Profile>’.
You can also rebuild the whole project, the selected CMake Profile (all target), or the selected configuration. The full list of available actions can be found in our web help.
Run Anything and Search Everywhere
This pair of universal dialogs improve your productivity while working with the IDE.
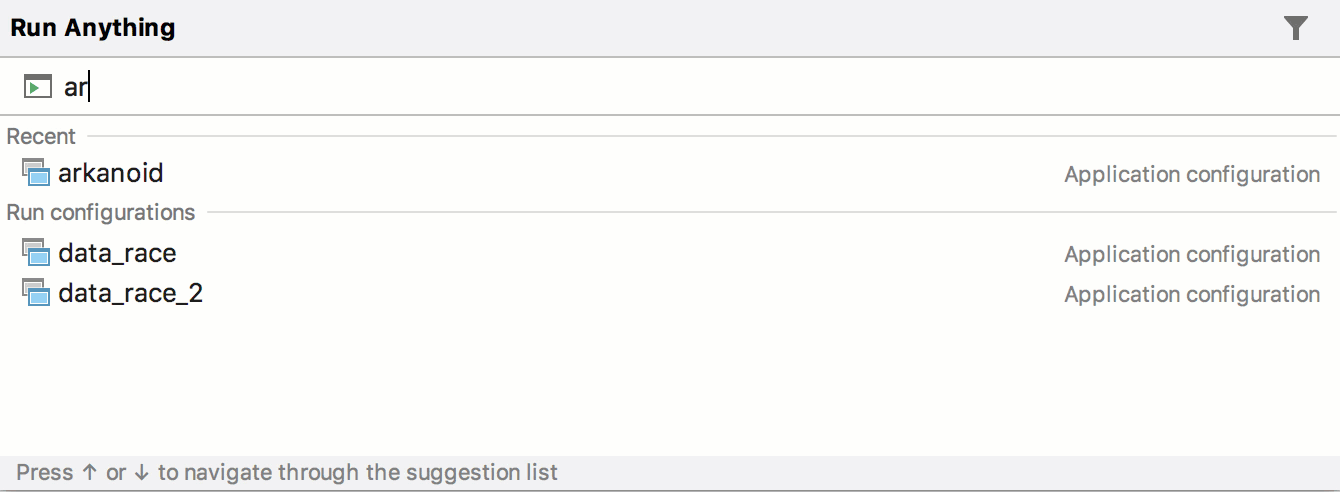
Use Double Ctrl to call Run Anything and launch any prefered configuration – simply type in the name. And if you want to debug this configuration – hold down the Shift key, and the dialog will switch to the Debug Anything mode. You can also use it to open a project – type “Open” and select the desired project from the list.
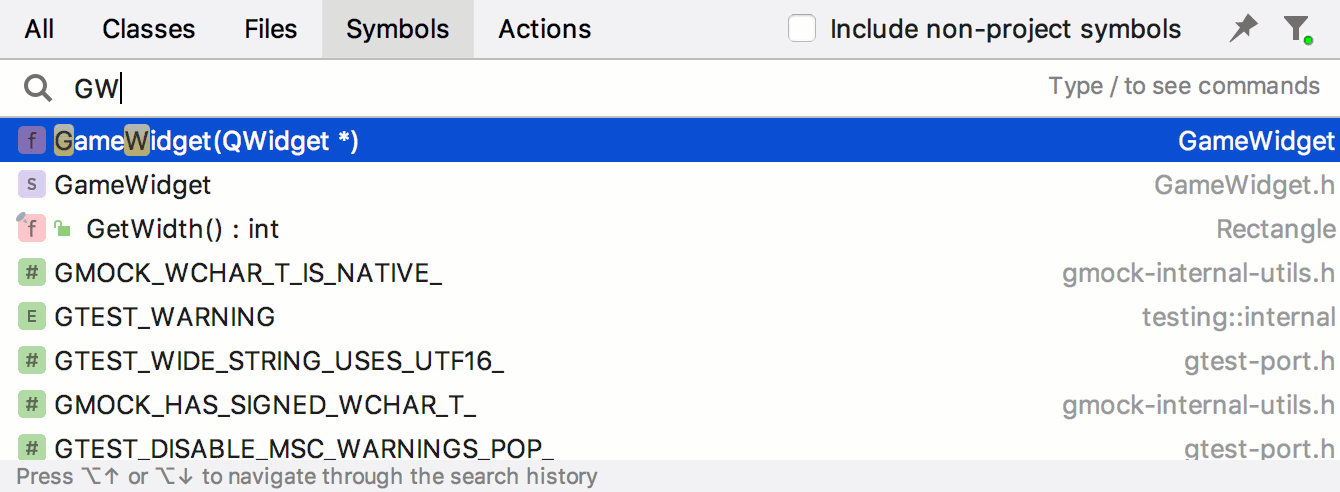
Double Shift opens the Search Everywhere popup, which now incorporates several actions at once: Go to class, file or symbol; Find an action, or search all of them at once (Search Everywhere). Use Tab to switch between the different actions. All of the previously available specific action shortcuts still work, so for example, Ctrl+N / ⌘O still opens the Classes tab.
Compilation database scheme compliance inspections
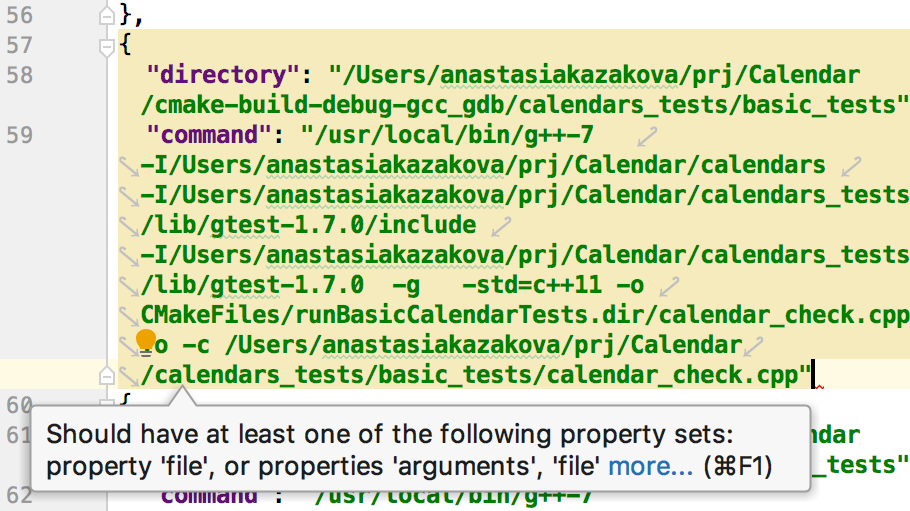
CLion 2018.3 comes with an array of inspections for compilation database json files, which are intended to provide checks on compliance with the compilation database JSON schema. For example, it can highlight situations when an incorrect type is used for the property value, or when the property is missing:
VCS enhancements
IntelliJ Platform, which underpins CLion, has recently introduced several important enhancements to how we work with Version Control Systems. First, Git submodules are finally supported! The IDE now ensures that when you clone a root repository, it will clone all the submodules. The same is true for updates, and other VCS actions work with submodules as well.
Another big change is the new GitHub pull requests tool window (VCS | Git | View Pull Requests). It lists all the pull requests to the repository. You can filter the view by pull request state (for example, state:open), assignee, author, etc. Besides, with a simple right click, you can create a new local branch for any pull request.
Check more about VCS enhancements on IntelliJ IDEA What’s New page.
Editor improvements
Multiline TODO
If you want to store more details in your TODO comments, it’s a good idea to split it into several lines. CLion nows handles this correctly – just add an indent starting from the second line of your multiline TODO comment:
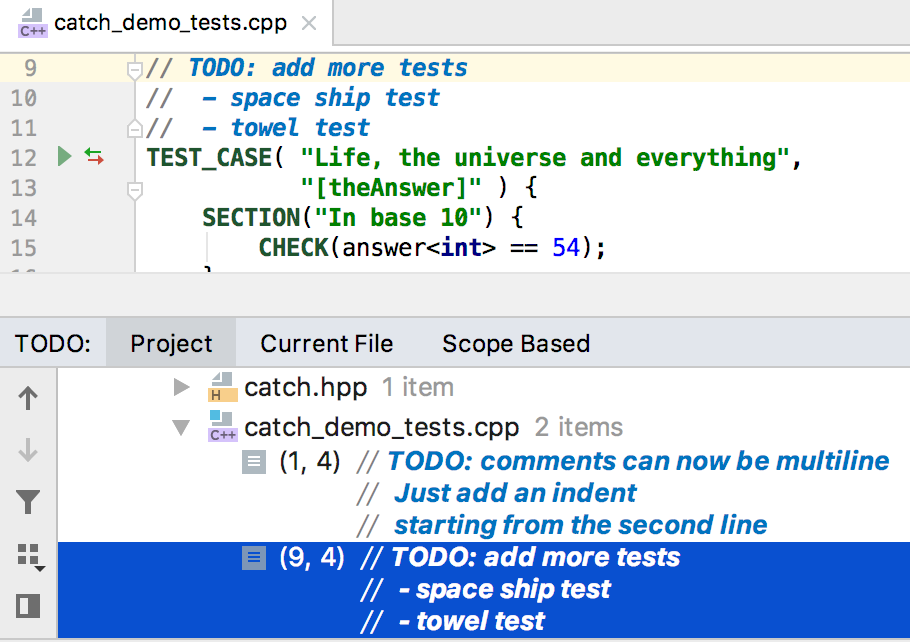
The IDE will differentiate the lines started with indent from an ordinary comment, and will highlight it as a TODO comment. In addition, the whole comment text will be presented in the TODO tool windows (View | Tool Windows | TODO).
Macro expansion in Quick Documentation
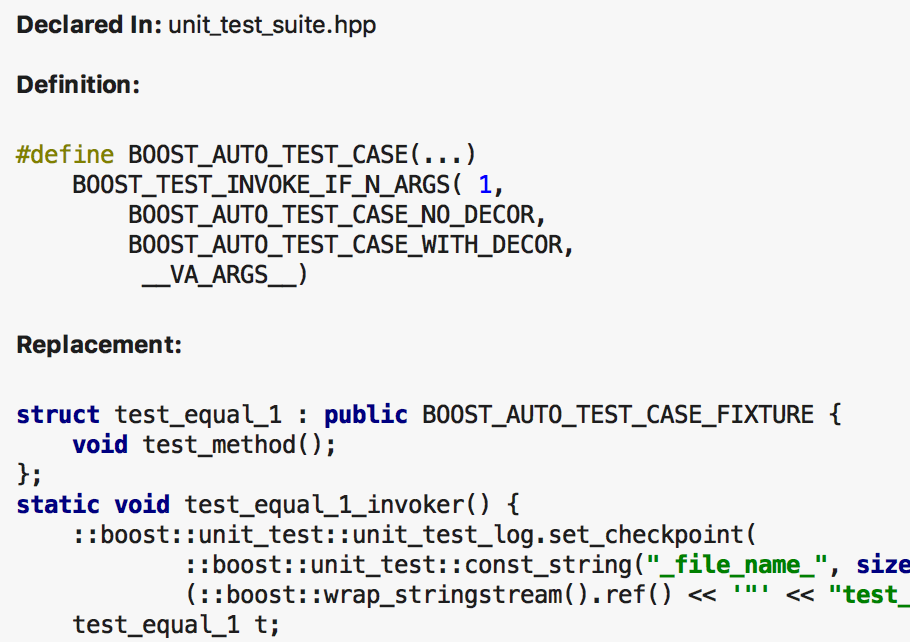
The Quick Documentation popup (Ctrl+Q on Windows/Linux, F1 on macOS) provides an easy way to understand the code that will be substituted after the preprocessor pass. When called on a macro, it shows the final macro replacement.
In v2018.3, the popup is now properly formatted and the keywords are highlighted. This can be really handy, for example, when dealing with boost macros:
Accessibility enhancements
A few new settings are available in Settings/Preferences | Appearance & Behavior | Appearance to make CLion (and other IntelliJ-based IDEs) accessible to as many people as possible. One of it is the brand-new High-contrast Theme.
New Plugins UI
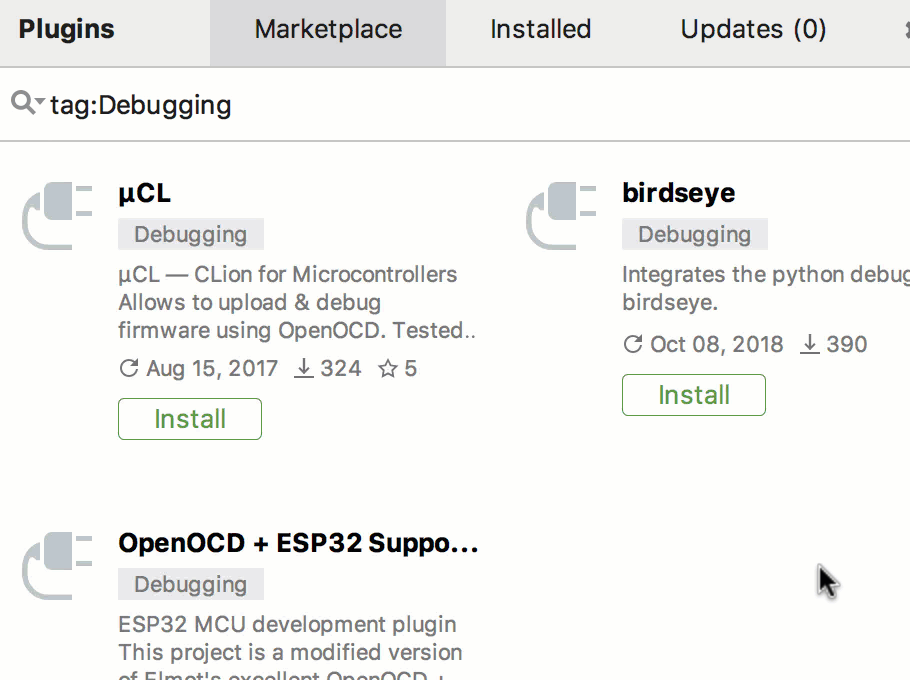
We’ve reworked the Settings/Preferences | Plugins page. Its new UI makes it easier to manage, install, uninstall, and update plugins. You can see the most valuable plugins grouped under Featured plugins, or sort all plugins by rating or number of downloads.
That’s about it! Try these new features by downloading CLion 2018.3 and starting your 30-day free evaluation. By the way, you can use this demo project from GitHub to check out some of the enhancements. Do give us your feedback, too!
Rust and Swift updates
CLion 2018.3 comes with the Swift Package Manager support in the Swift plugin. Simply open the SPM project in CLion and work with it – no additional configuration required. Read more and watch a short demo.
Rust plugin was updated to get partial Rust 2018 support, Move analysis inspection and Cargo unit testing support.
Your CLion Team
JetBrains
The Drive to Develop


