CLion 2020.3 EAP: Postmortem Debug With a Core File

In the previous 2020.3 EAP build we were focused on giving run/debug configurations and CMake profiles more flexibility in CLion, and at the same time we introduced a bundled tool for collaborative development and pair programming. In this EAP update we are adding one of the most long-awaited features in debugger – postmortem debug with a core file!
Build 203.5600.25 is available from our website, via the Toolbox App, and as a snap package (if you are using Ubuntu).
Core dump (crash dump) debugging is a debugging approach in which core dump files are analyzed. These files are copies of process memory captured at the time when the program crashed or otherwise terminated abnormally. The main idea behind the approach is to investigate the state of the variables and other memory of a crashed process at the moment the application crashed in order to determine the cause of the problem.
There is obviously no stepping involved in this process, as you only get a memory snapshot for the time of a crash. However, with the help of the symbol table the dump can be interpreted to identify variables symbolically and display the corresponding source code.
CLion now comes with support for such postmortem debugging with a core file. Let’s take a closer look.
How to set a core dump debugging session in CLion
There are two ways to start a core dump debugging session:
- Select the Run | Open Core Dump… action in the menu.
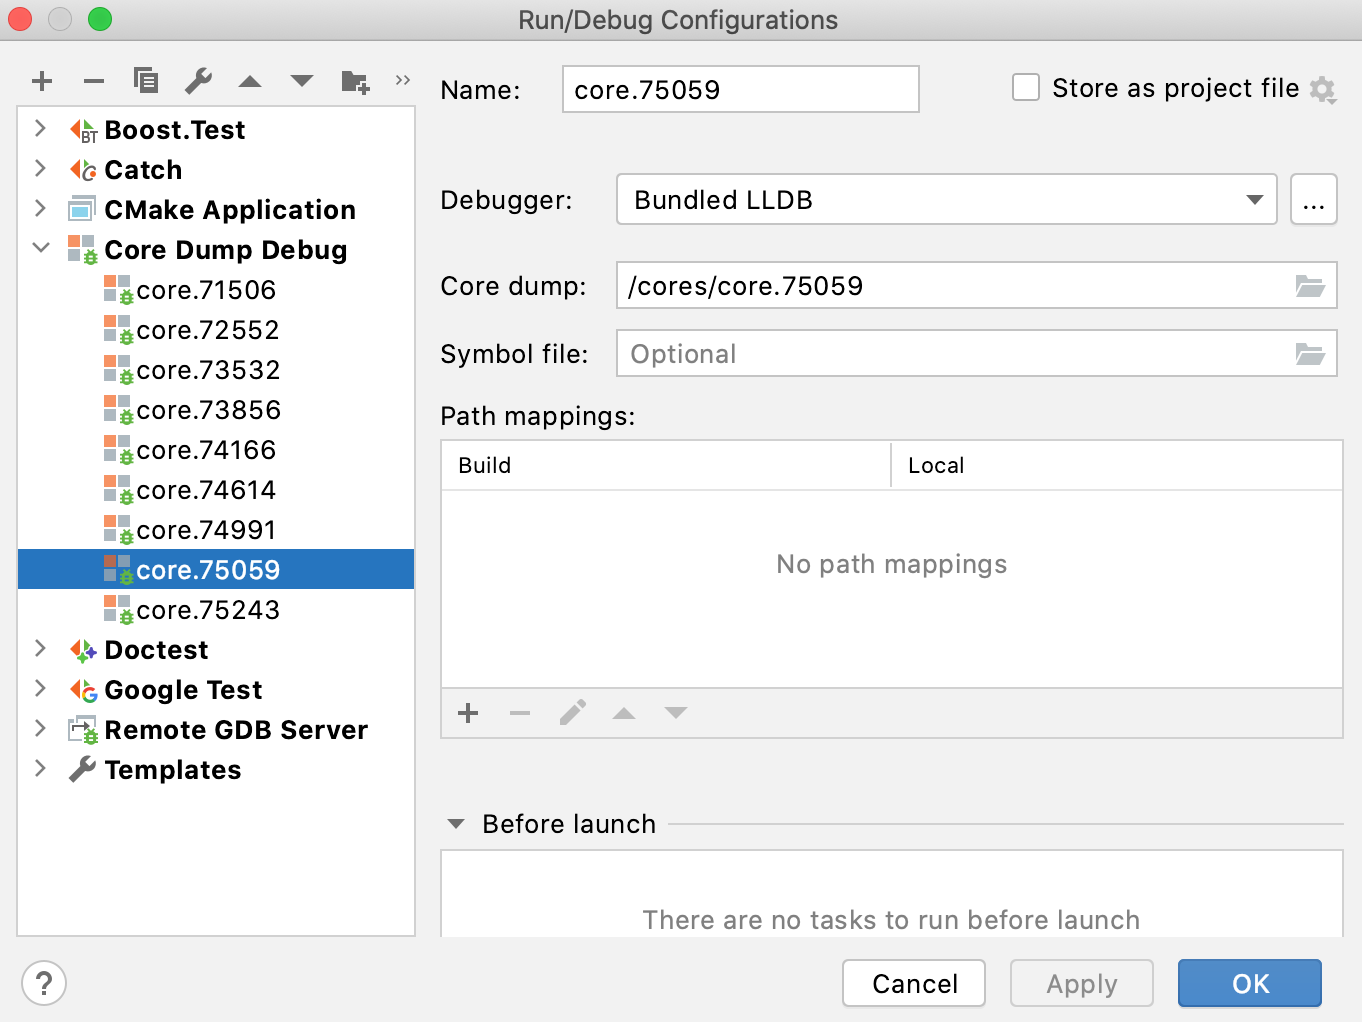
- Create a new Core Dump Debug configuration in the list of Run/Debug configurations in CLion and launch it.
The Open Core Dump action launches an existing Core Dump Debug configuration or creates a new one for you.
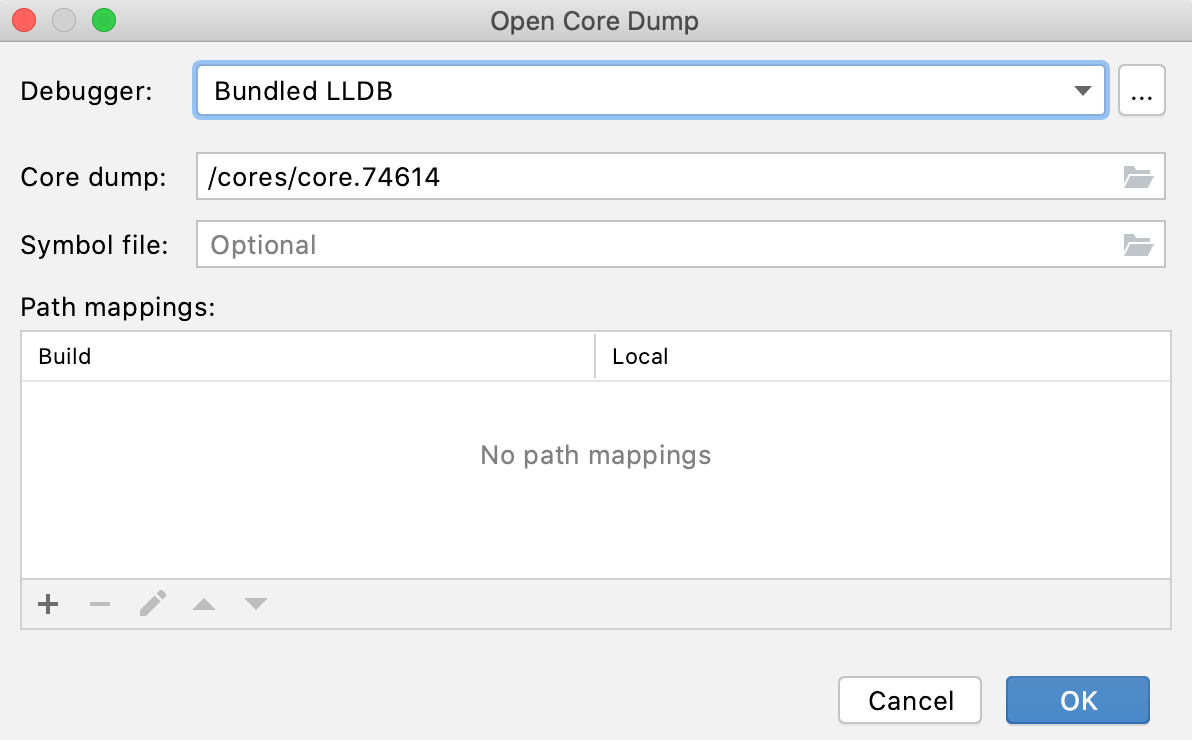
Regardless of how you prefer to start a session, you need to provide CLion with:
- A specific debugger to be used: it can be a bundled LLDB, a bundled GDB, a custom external GDB, or a custom GDB from an existing toolchain. By default, the bundled LLDB is selected if the default toolchain is configured with LLDB, and the bundled GDB is selected by default in all other cases.
- A core dump file: you can specify a path or use a file chooser to select a core dump file.
- A symbol file: CLion needs this in order to identify the program symbols correctly and navigate you to the proper source code locations. A program’s binary executable file can be used for this purpose if it’s built with the debug info. However, symbols from the linked libraries built without any debug info will be available only if related debug symbols are located in default search directories. Note that when using LLDB the symbol file is currently not used by CLion, but we plan to fix this – see issue CPP-22539.
- Path mappings, if the binary was built on another machine with different file/directory names and paths.
The paths will be automatically validated to check that the files exist.
When all of the above is provided, a new run/debug configuration is created and ready to be launched (the Open Core Dump action will launch it for you). The name of this configuration is chosen automatically using the name of the corresponding core dump file.
Launching a core dump debug session
The easiest way to launch a session to debug a core dump is via the Open Core Dump… action from the Run menu. The dialog it opens is just a simple way to set up a run/debug configuration without opening the Edit Configurations… dialog.
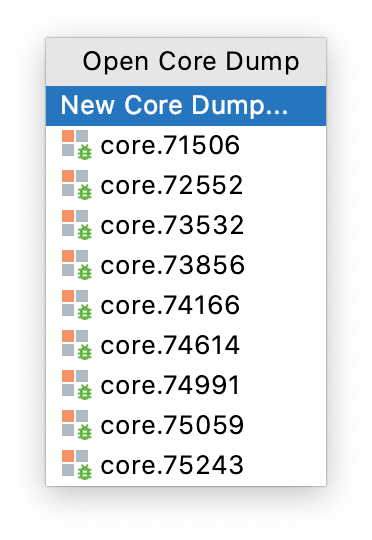
If there are existing core dump debug configurations in the project, the Open Core Dump action starts with a popup menu containing all of them and a special item named New Core Dump… which just opens the Core Dump dialog:
Core dump debug process in CLion
When the core dump debug process is launched in CLion, you’ll see the Debug tool window and the source code will be opened for you automatically. You can inspect the frames and variables view, check the memory or diasassembly view and evaluate some expressions, or run debugger commands from the debugger console available in the tool window:
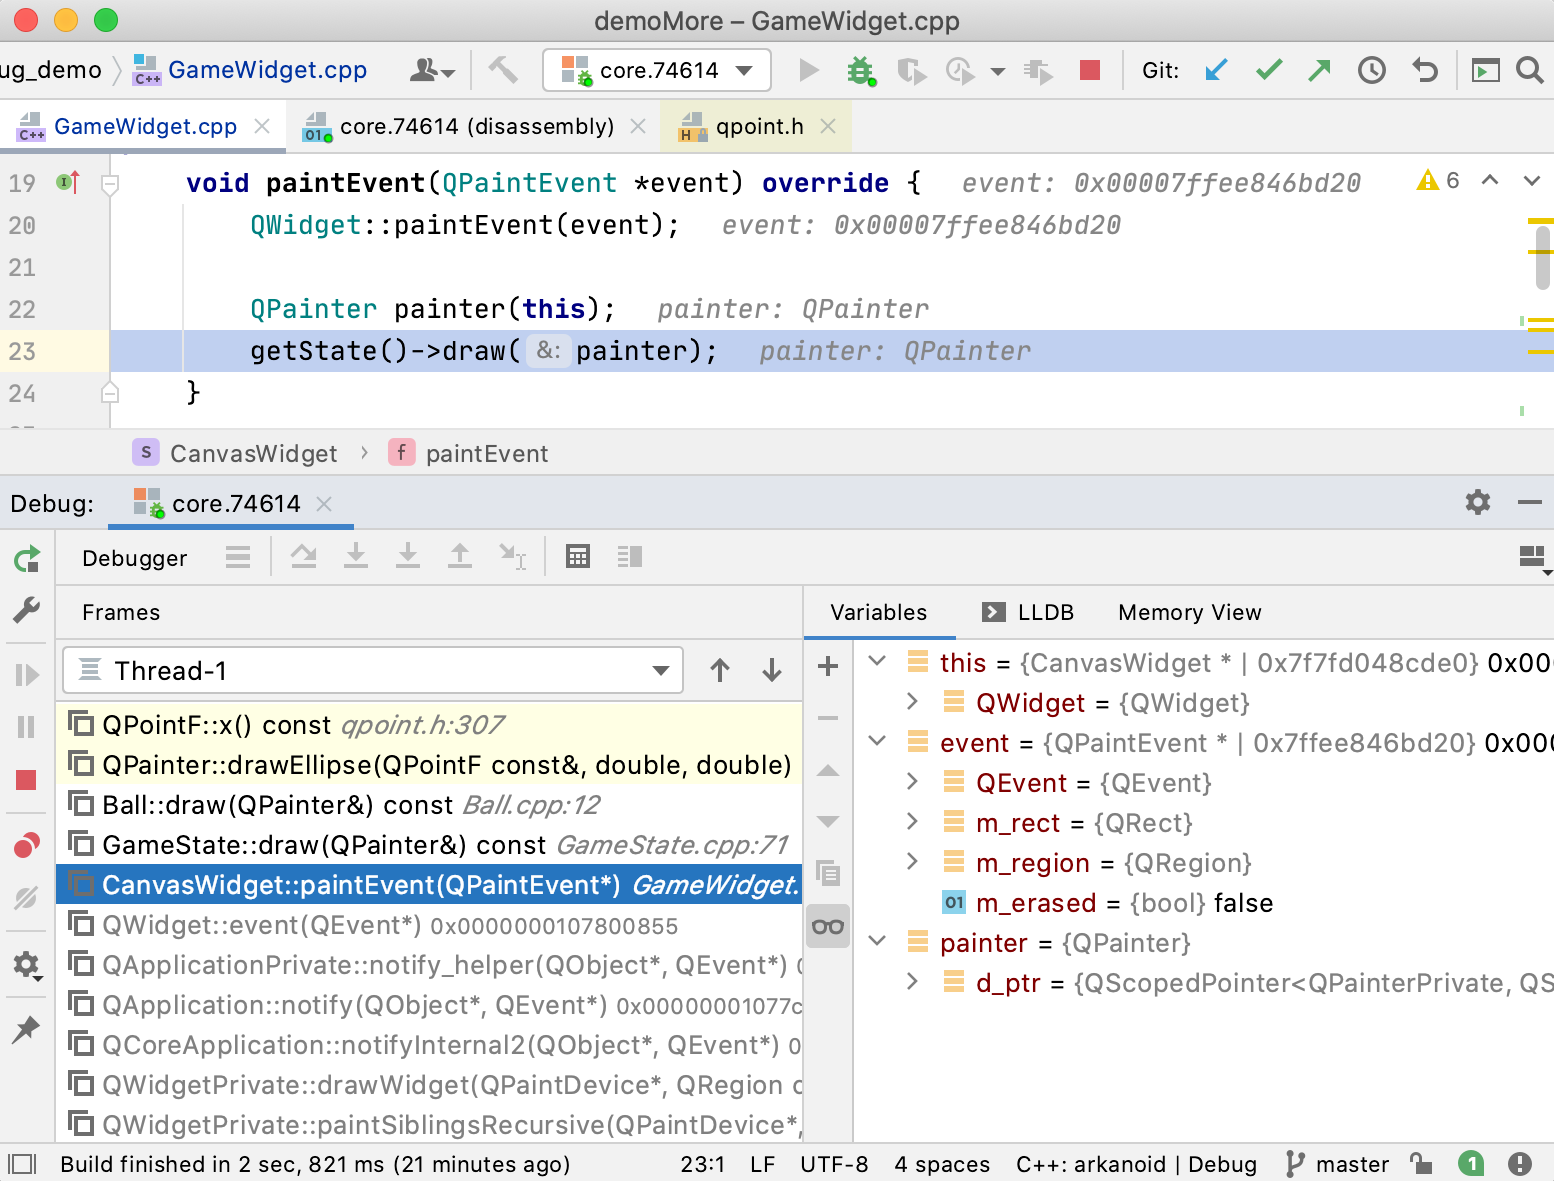
Since the core dump is a static snapshot of the program state, the console tab (with process output) is hidden and stepping is disabled.
Known issues and limitations
Core Dump Debug in CLion is still in its early stages with various limitations and known issues:
- It is currently only available on Linux and macOS (find a feature request for Windows here).
- The symbol file is currently ignored by CLion in case of LLDB (CPP-22539).
- Support for analysis of core dumps collected on another machine or debugging core dumps remotely are currently very limited (CPP-22736, CPP-22656).
In other news
In other debugger news, we’ve added the option to select any custom GDB binary in the Remote GDB Server configuration.
That’s it for now. The full release notes are available here. Try out the new EAP build today, and please share your feedback with us in the comments below or in our issue tracker.
Your CLion team
JetBrains
The Drive to Develop