CLion 2024.3 EAP 4: New Embedded Development and Debugging Features

The new CLion 2024.3 EAP build, 243.19420.28, is out. You can download it for free from the link below, via the Toolbox App, or as a snap package if you’re using Ubuntu.
This build includes new features for embedded development, such as debug servers, the ability to edit peripheral register values, and support for debugging Zephyr West projects. Also, while debugging, you can now view string values that contain newline characters or JSON, XML, or HTML data with the relevant formatting.
Debug servers
Configuring debugging for embedded systems can be challenging, especially when working with different boards, probes, and run/debug configurations. We’ve decided to streamline this process by adding a new Debug Servers configuration option. It’s a separate section in Settings | Debugger where you can set up a debug server based on gdbserver. This new feature offers two great advantages:
- Using a pre-configured debug server, you can run any run/debug configuration or build system target, such as CMake, West, Makefile, etc. Previously, you had to set up a separate run/debug configuration for each build system.
- This also allows you to run long-living debug server sessions, meaning the server does not shut down when you stop debugging.
Please note that this is an experimental feature. It’s intended to provide a simpler and more intuitive approach to debug configuration than the current version of CLion offers. We encourage you to try it and share your feedback. We would also be happy to arrange a quick call with you to learn more about your specific use cases and challenges.
How to get started
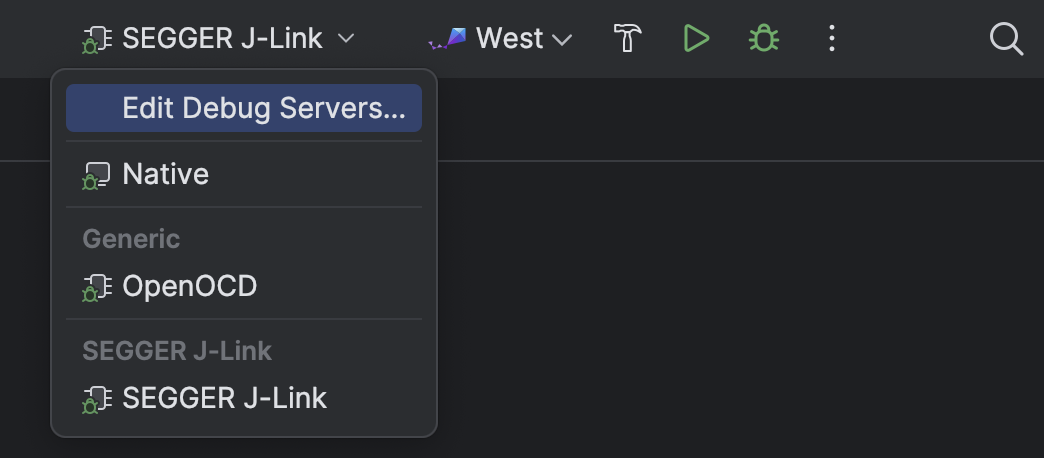
To use debug servers, first enable them in Settings | Advanced Settings | Debugger. Then, you’ll be able to find the Debug Servers dialog in Settings | Debugger or via Edit Debug Servers from the main toolbar switcher.
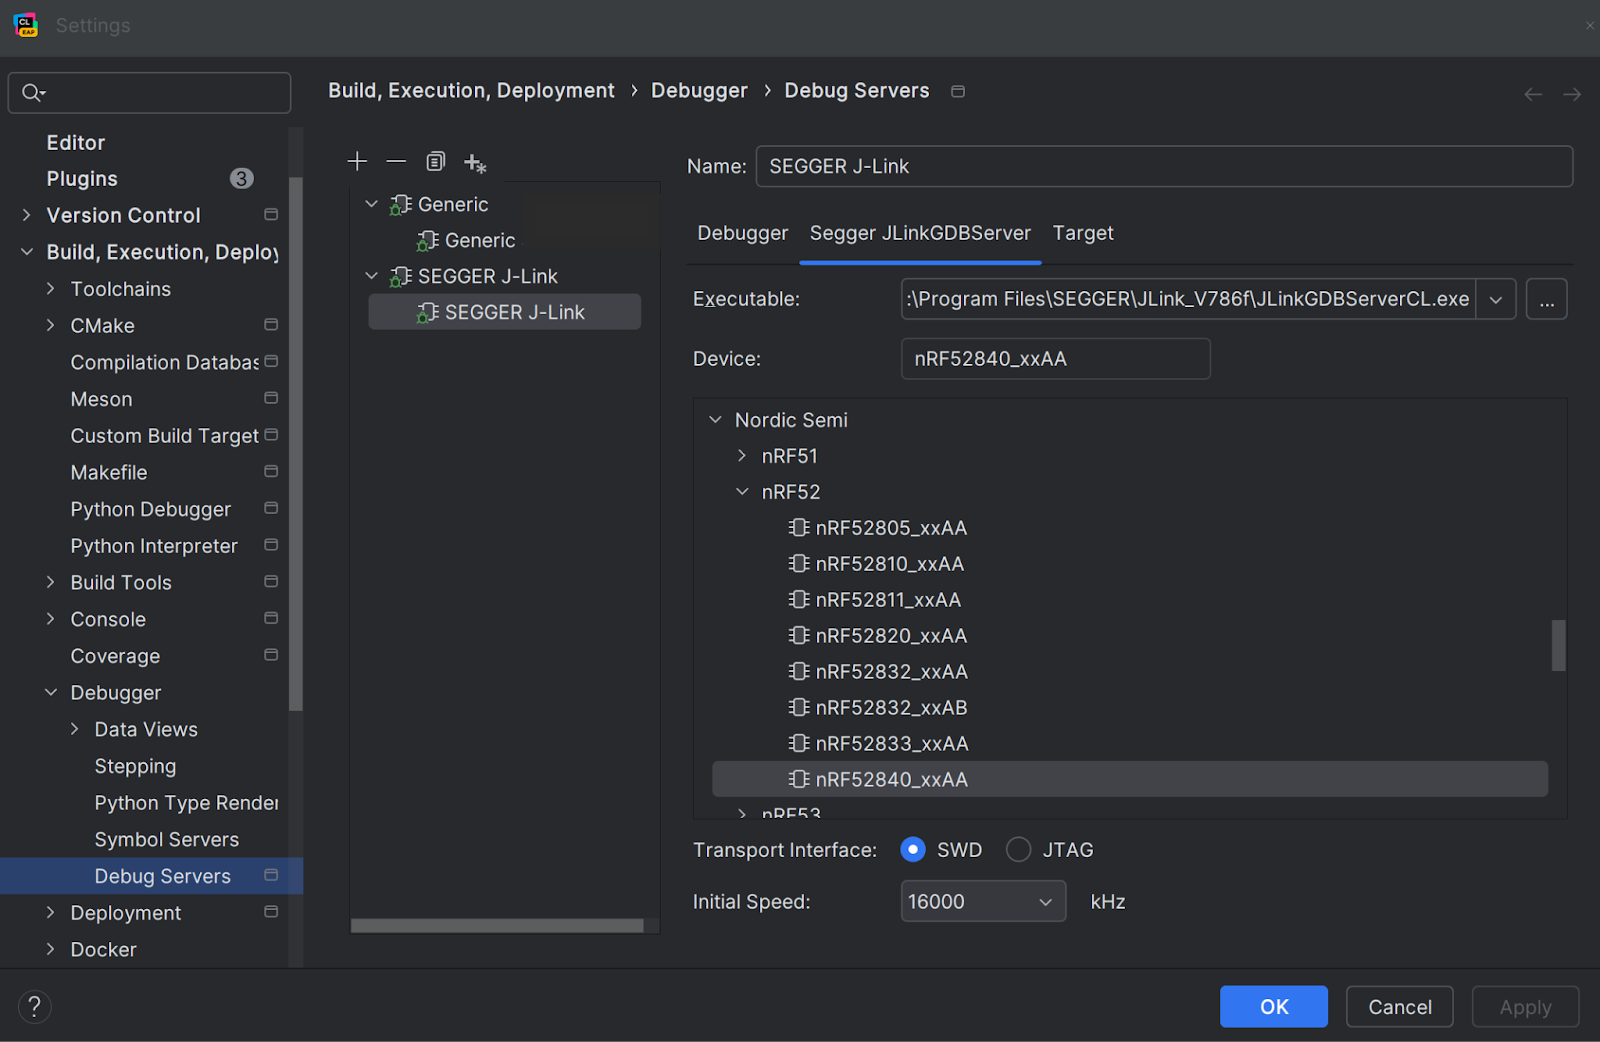
In the Debug Servers dialog, you can select from two template types:
- Generic templates are more customizable and offer a wider range of options for any debug probe.
- SEGGER J-Link templates are specifically designed for J-Link debug probes. They are more straightforward and less flexible than generic ones, providing only the necessary options.
After you configure your debug server, it will be available in the Debug Servers switcher in the main toolbar.
Additional features
If you already have a gdbserver run configuration in CLion, the IDE will recognize it and allow you to import it into a generic template. You can also convert a SEGGER J-Link configuration into a generic one, which allows you to customize the debug server in more detail.
Additionally, in the Debugger tab, we’ve added a new option for remote debugging, Persistent connection (target extended-remote), which maintains the connection to the debug server even after the session is closed. Using a persistent connection is useful when you want a debug server to be ready for the next session without having to wait for it to start back up. It’s often used in embedded development and is recommended by OpenOCD as the default mode.
Editable peripheral register values
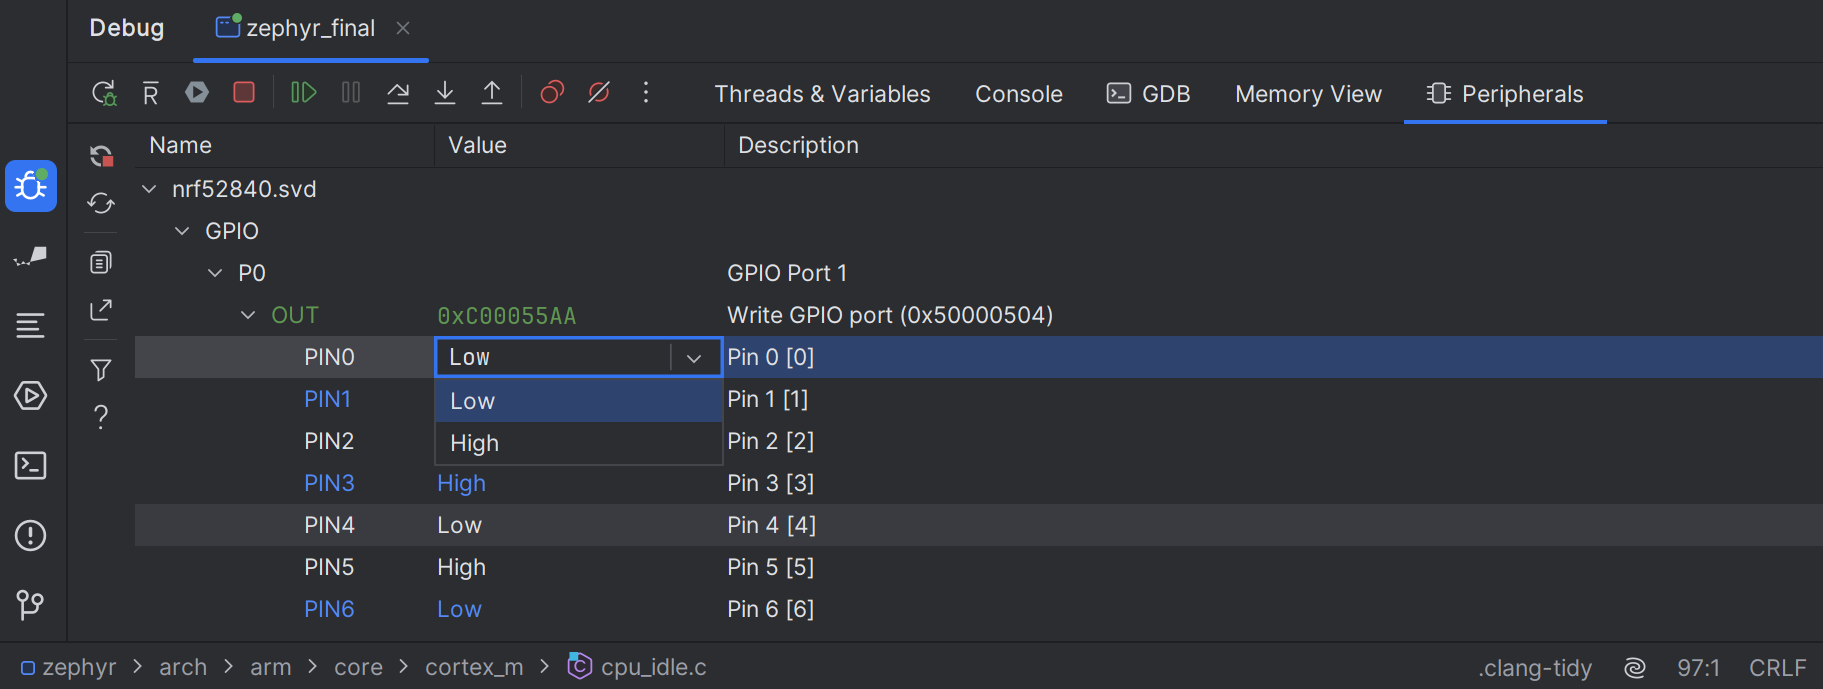
When debugging board peripherals like GPIO pins or timers, you can immediately see the effects of your changes by editing peripheral registers. This allows you to test different configurations and device states without recompiling your source code or reloading your application or board.
The ability to edit register values was one of the most requested features (CPP-16747), and we’ve added it in this EAP. You can now change register values during debugging sessions in the Peripherals pane of the Debug tool window.
Formatted view for strings with JSON, XML, or HTML data
C++ string variables can store JSON, XML, and HTML data for configuration management, parsing structured data, and other purposes. Debugging such strings, as well as those containing newline characters (\n), is now more convenient, as you can view them directly in the debugger formatted according to their code style (CPP-40257). You no longer need to copy unformatted values into a third-party tool to examine them.
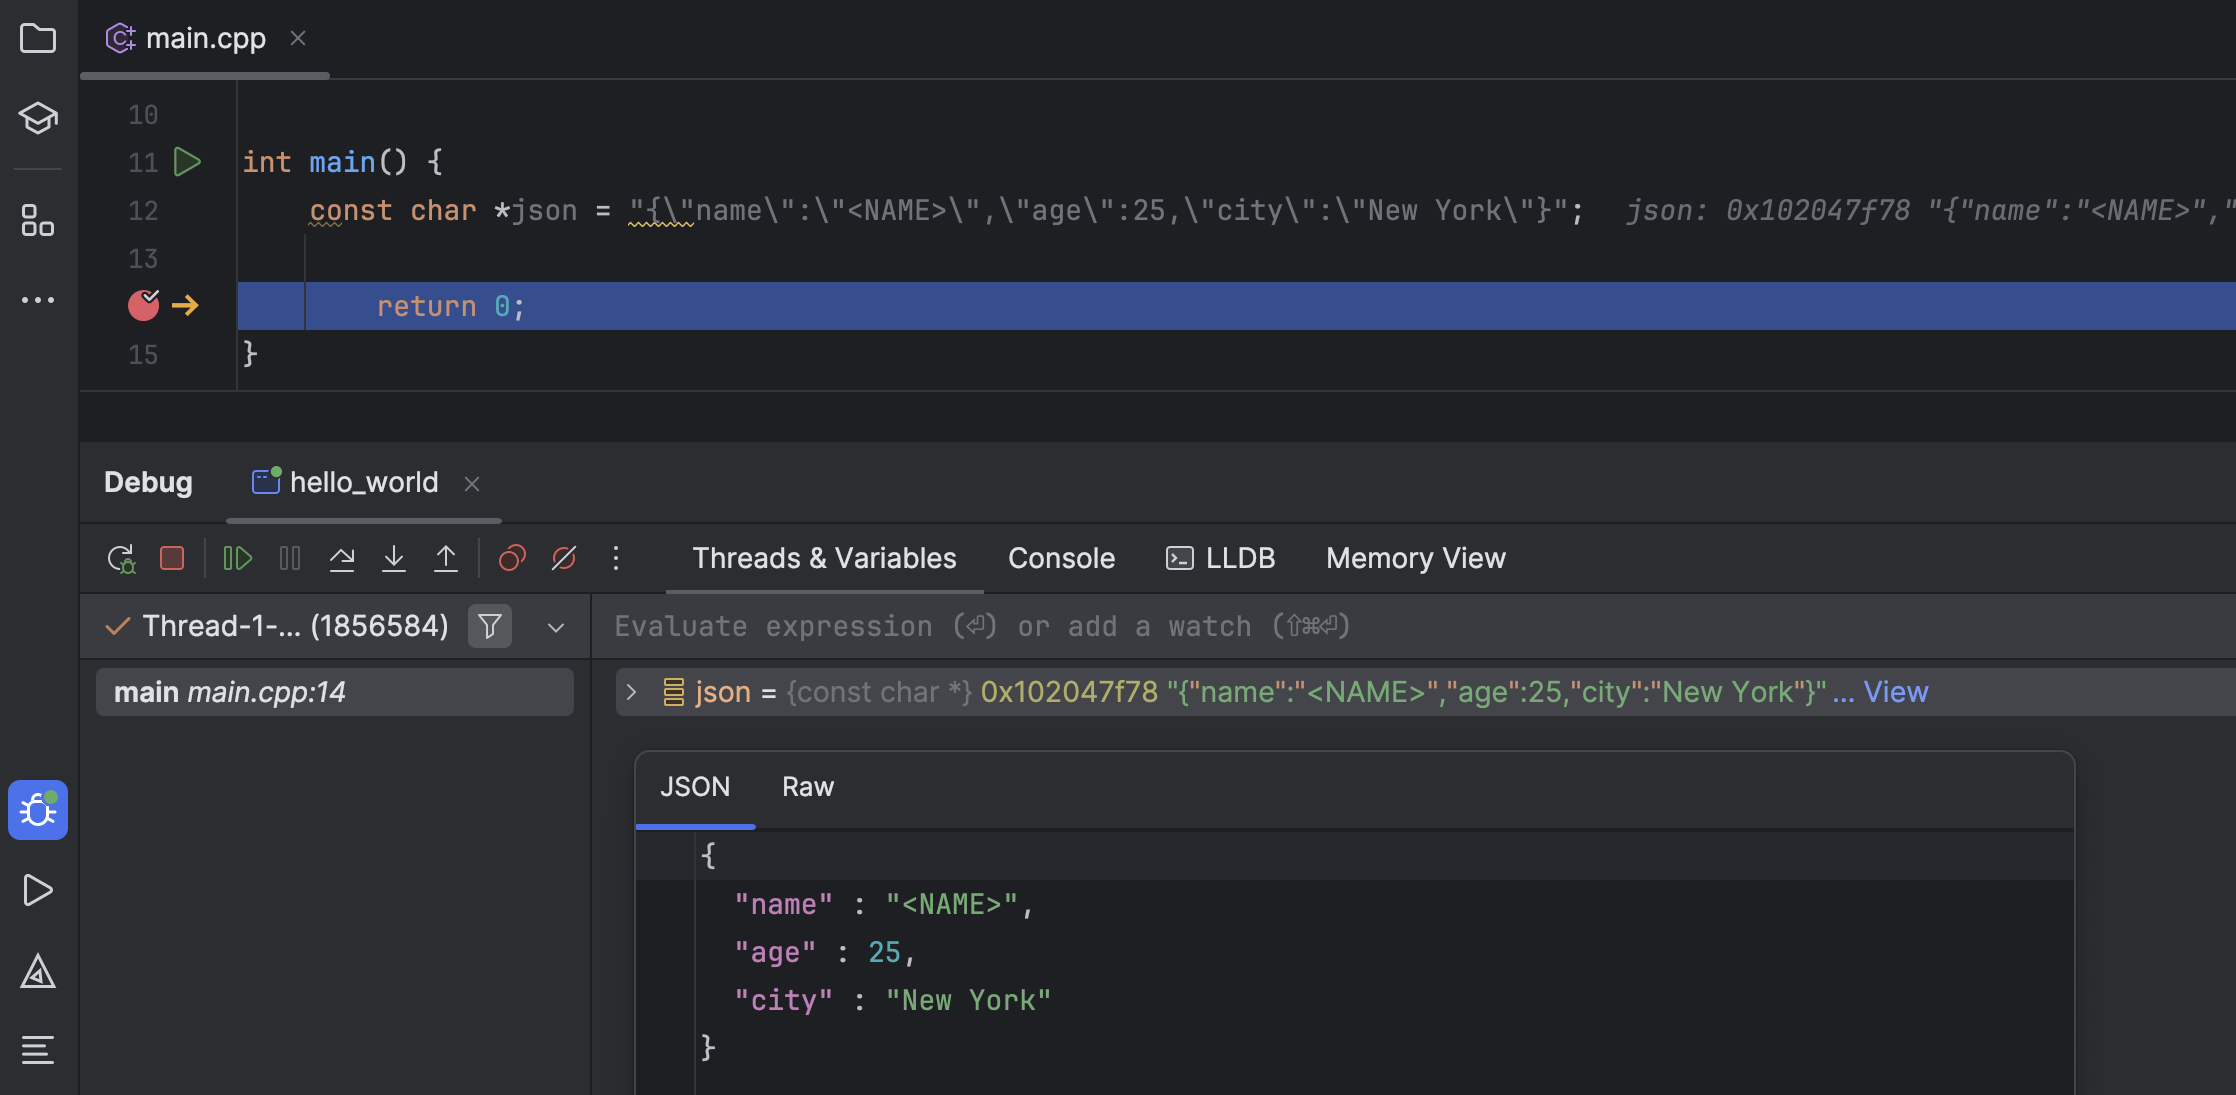
To view a string’s values, click the View button, which is displayed next to it in the Threads & Variables pane. A separate dialog will appear where you can view the values as formatted or raw data.
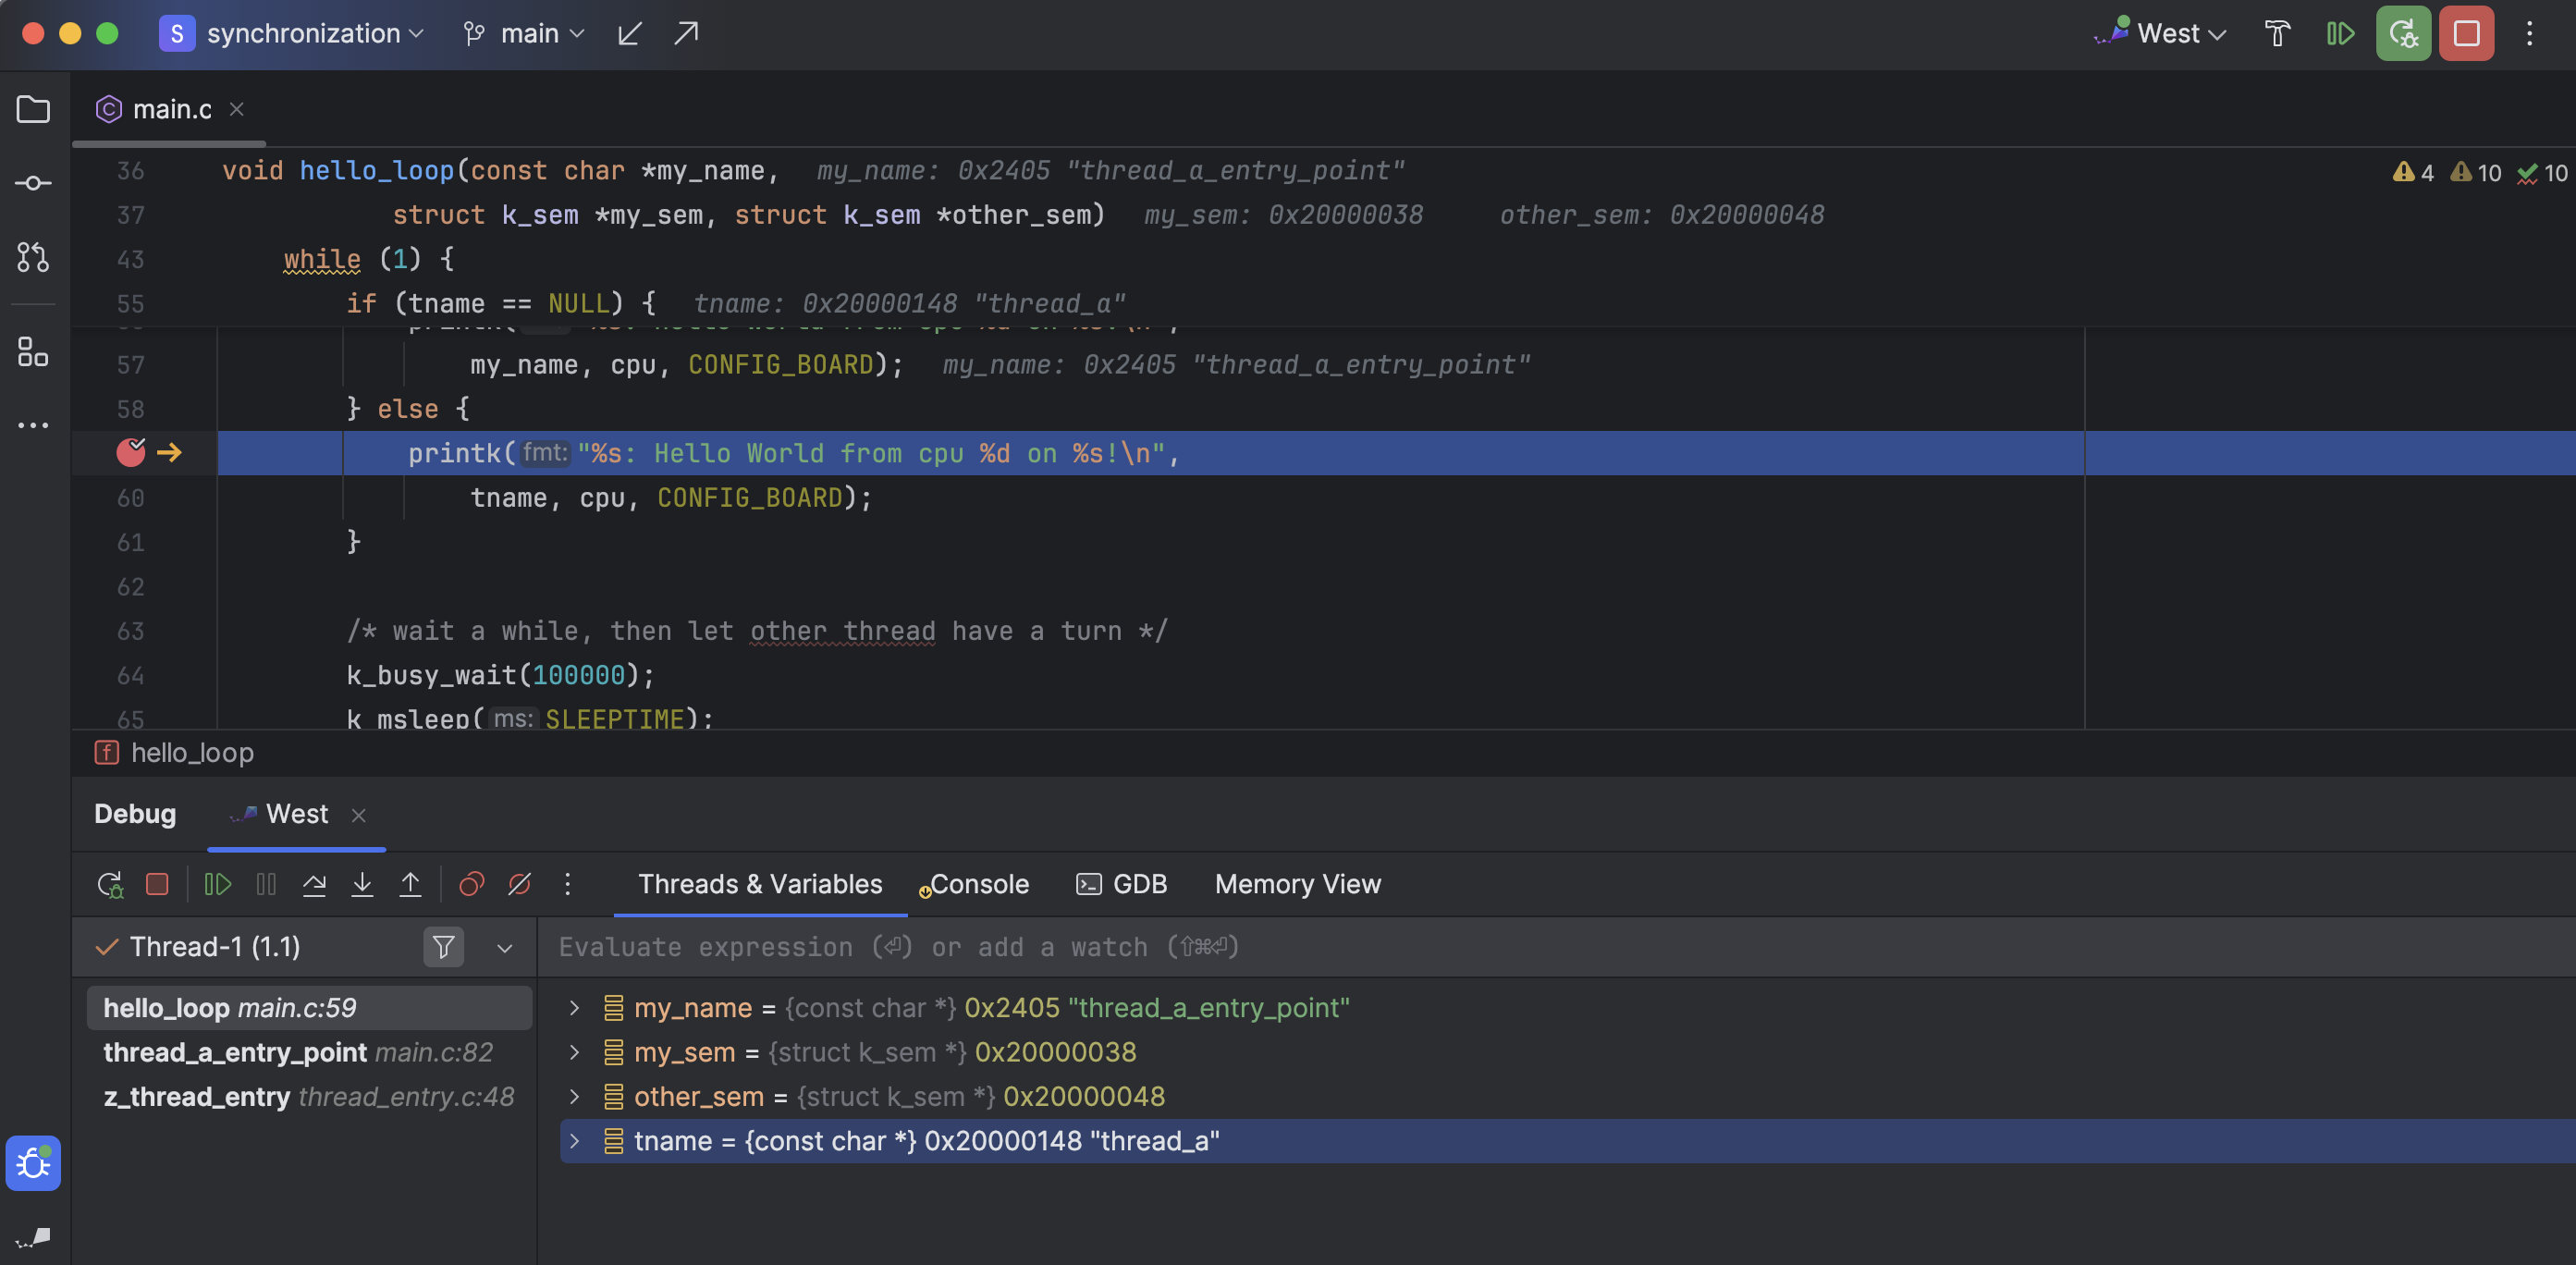
Debugging support for West
We added support for Zephyr West in CLion 2024.2. In this EAP, we’ve extended the initial functionality, adding the ability to debug West projects. This makes it easy to configure and run debugging sessions directly in the IDE.
When you import your Zephyr West project, a West run/debug configuration is automatically created in the Run/Debug Configurations switcher.
You can also create a new run/debug configuration. Simply select Run | Edit Configurations… in the main menu, click +, and select a Zephyr West template:
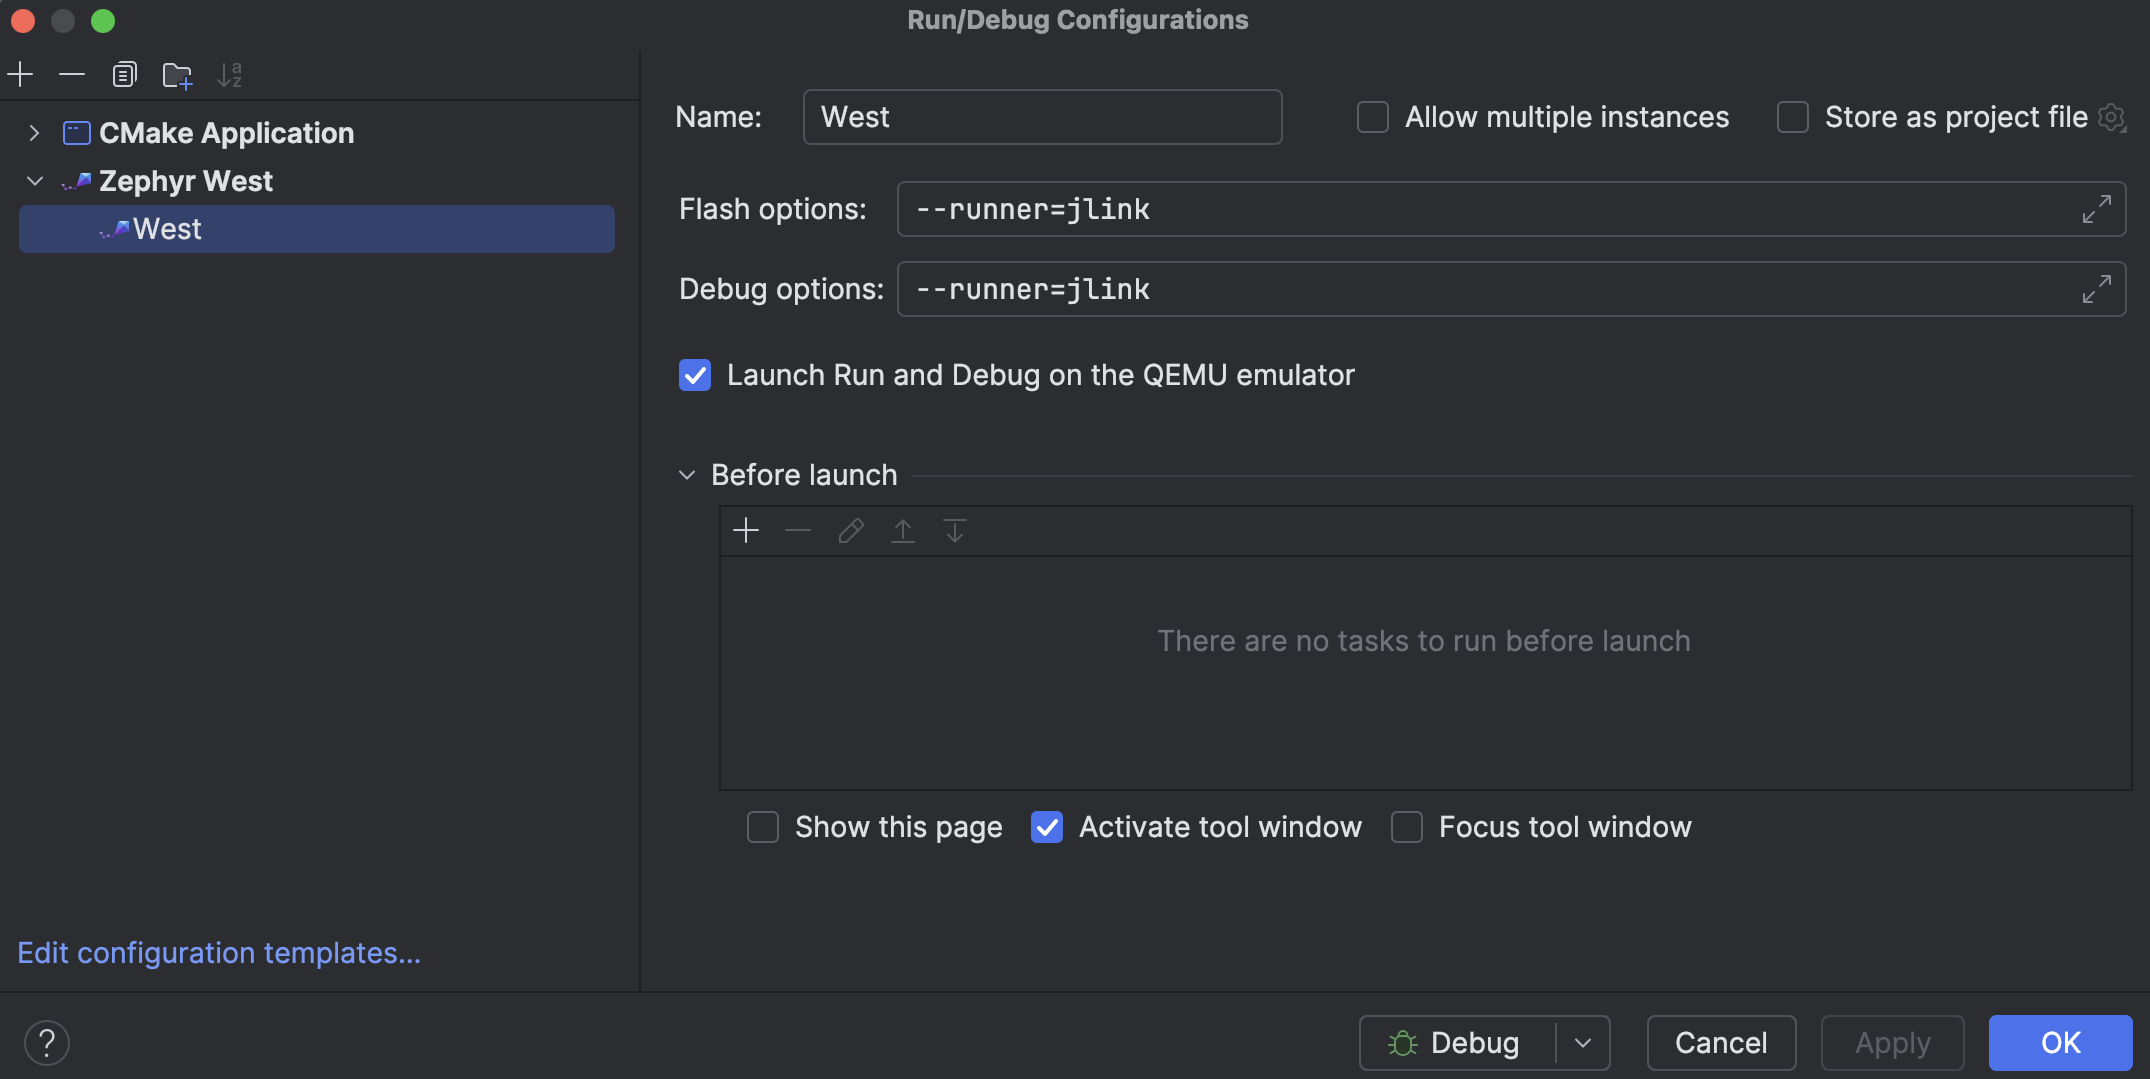
You can copy the command line arguments you used to run west debug and paste them into the Debug options field.
Once configured, the new West run/debug configuration will be available in the Run/Debug Configurations switcher. You can launch a debug session using the green Debug button on the main toolbar or the shortcut – ⌃D (macOS) or Shift+F9 (Windows/Linux).
Other new features in this EAP
To learn more about other recent improvements in the 2024.3 EAP, check out these blog posts:
- The CLion 2024.3 Early Access Program Is Open covers enhanced cloud code completion, CLion Nova updates, and features for embedded development.
- CLion 2024.3 EAP 3 highlights the OpenCV image viewer and the ability to attach the debugger to unstarted processes.
Call for feedback
Your feedback is important to us, as your experiences and insights are essential to our mission of continuously improving CLion. Please share your ideas in the comments section below or submit them to our issue tracker. We would also be interested in setting up a quick call with you to learn more about your specific use cases. Let us know if you would like to participate!
Your CLion team
JetBrains
The Drive to Develop