Datalore
Collaborative data science platform for teams
Analyzing Company Financial Data with Python and Datalore AI
This is a guest blog post by Ryan O’Connell, CFA, FRM.
Introduction
In the twilight of 2022 and the dawn of 2023, the tech industry was rocked by a seismic shift. Giants like Meta, Amazon, Microsoft, Google, and Salesforce – names that once seemed impervious to economic tremors – announced wave after wave of substantial layoffs. The very foundations of Silicon Valley trembled, leaving countless tech workers anxious about their future in an industry that had long been synonymous with growth and opportunity.
“But beyond the human impact, a pressing question emerged: Were these layoffs a desperate measure or a calculated strategy to boost profitability?”

In this article, we’ll dive deep into the numbers behind some of the biggest layoffs in recent tech history. Our mission? To uncover whether these workforce reductions truly allowed these behemoths to become more profitable.
The logic seems simple at first glance. Layoffs should lower operating expenses, thereby reducing overall costs. Given that profit is the difference between revenue and expenses, it follows that if layoffs can trim expenses without causing a proportional drop in revenue, the company’s profitability should increase.
However, the equation isn’t always so straightforward. Critics argue that massive layoffs risk crippling a company’s ability to innovate and maintain quality, potentially leading to reduced revenue that outweighs any cost savings. After all, in the knowledge-driven tech industry, employees are often a company’s most valuable asset.
So, did these tech giants make a savvy financial move, or did they sacrifice long-term potential for short-term gains? We’re about to find out, using hard data and the power of Python analysis.
Today, we’ll leverage Datalore’s AI Assistant to complete a tech layoffs impact analysis step by step, making this exploration accessible whether you’re a seasoned coder or just dipping your toes into the world of data analysis.
If you want to follow along more closely, you can access the code of our implemented financial statement analysis in this Datalore report. If you don’t want to read through our research methodology, you can jump straight to the impact analysis.
Compiling the layoff data
To begin our analysis, we need to establish a clear picture of the layoffs we’re examining. We’ve compiled data on some of the most significant layoff events in the tech industry during late 2022 and early 2023, focusing on industry giants Meta, Amazon, Microsoft, Google, and Salesforce. This data, sourced from layoffs.fyi, a reputable tracker of tech industry job cuts, provides us with crucial details about each event. The table below highlights the specific layoffs we’ll be analyzing:
| Company | Employees Laid Off | Layoff Date | Percent of Workforce |
| Meta | 11,000 | 11/9/2022 | 13% |
| Amazon | 10,000 | 11/16/2022 | 3% |
| Salesforce | 8,000 | 1/4/2023 | 10% |
| Amazon | 8,000 | 1/4/2023 | 2% |
| Microsoft | 10,000 | 1/18/2023 | 5% |
| 12,000 | 1/20/2023 | 6% | |
| Meta | 10,000 | 3/14/2023 | 13% |
| Amazon | 9,000 | 3/20/2023 | 2% |
By structuring this information into a DataFrame, we create a foundation for our subsequent financial analysis. This approach allows us to correlate layoff events with financial performance, giving us a data-driven perspective on the impact of these workforce reductions. As we proceed, we’ll use this dataset to guide our exploration of each company’s financial metrics before and after these pivotal moments in their recent history.
| Datalore AI Prompt |
| Create a Python script that does the following: 1. Import necessary libraries (pandas, datetime).2. Create a DataFrame with the following layoff data: Company, number of employees, layoff date, percent of workforce reducedMeta, 11,000, 11/9/2022, 13%Amazon, 10000, 11/16/2022, 3%Salesforce, 8000, 1/4/2023, 10%Amazon, 8000, 1/4/2023, 2%Microsoft, 10000, 1/18/2023, 5%Google, 12000, 1/20/2023, 6%Meta, 10000, 3/14/2023, 13%Amazon, 9000, 3/20/2023, 2% 3. Convert the ‘layoff date’ column to datetime format. 4. Calculate some basic statistics about the layoffs, such as the total number of employees laid off by each company, and the total % of employees laid off by each company. 5. Concatenate the basic statistics into a single dataframe. |
Accessing financial data: setting up the Polygon.io API
To analyze the financial impact of these layoffs, we need access to reliable and up-to-date financial data for each company. For this purpose, we’ll be using Polygon.io, a comprehensive financial data API provider. Polygon.io offers a wide range of financial data endpoints, including detailed quarterly financial statements, which are crucial for our analysis.
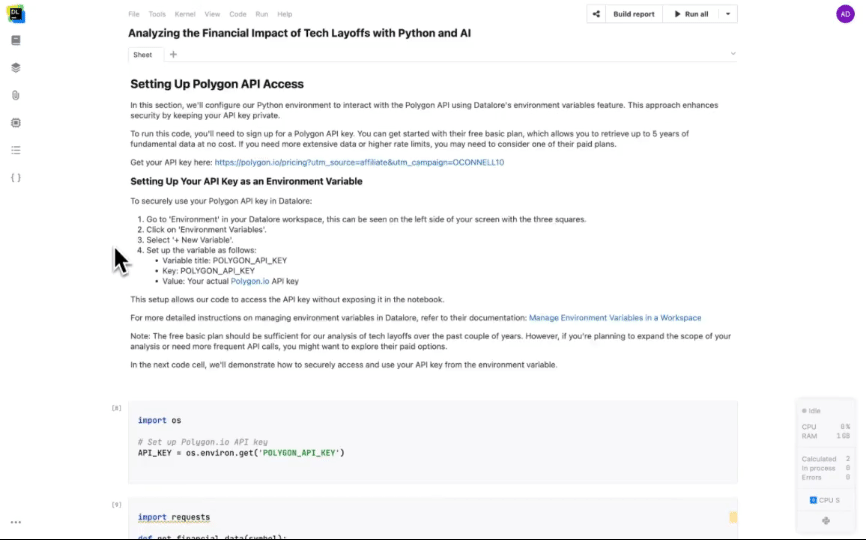
Before we can start pulling data, we need to set up our access to the Polygon.io API. For this analysis, we’ll be using Polygon.io’s Basic plan, which is free and provides access to up to two years of fundamental data. This is sufficient for our current analysis, as it covers the period of the layoffs we’re examining.
To get started with Polygon.io and follow along with this analysis, sign up for a free Basic plan here.
Once you’ve signed up for a Polygon.io account, you’ll receive an API key that grants you access to their financial data. However, instead of directly inserting this key into our code, we’ll take a more secure approach by setting it up as an environment variable in Datalore.
To set up your API key as an environment variable, follow the short video tutorial below:
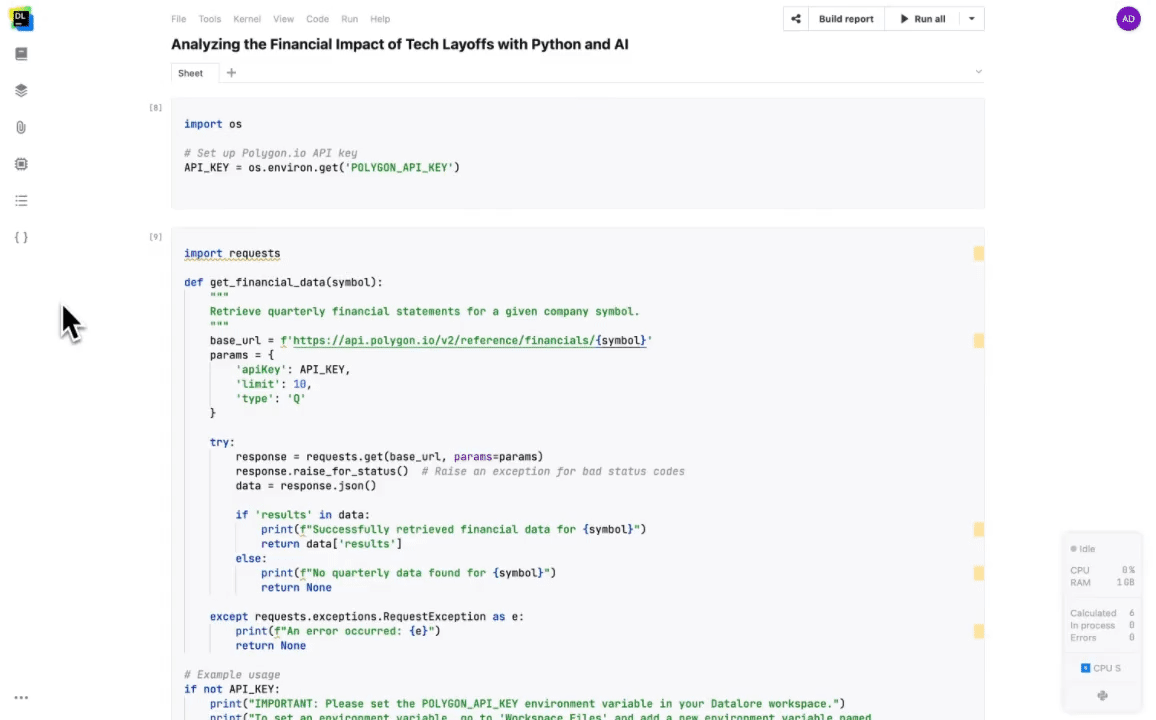
By configuring your API key as an environment variable, we can access it in our code without exposing it directly in the notebook. This approach enhances security and makes it easier to manage sensitive information.
Querying the Polygon API and pre-processing financial data
In this section, we’ll focus on fetching quarterly financial statements for each of the companies in our layoff dataset. These statements will provide us with crucial information about revenue, operating expenses, and net income, allowing us to assess the financial impact of the layoffs.
We’ll use the function we created in the previous section to query the Polygon API for each company. Our goal is to retrieve data for several quarters before and after each layoff event, giving us a comprehensive view of each company’s financial trajectory. We’ll store this data in a structured format, setting the stage for our subsequent analysis and visualization efforts.
Some companies have multiple layoffs, which requires us to carefully mark periods relative to each layoff. We’ll create a column to distinguish between pre- and post-periods for each layoff event. This will give us a more granular view of the financial impact of multiple layoffs.
Here is the prompt I crafted to get Datalore’s AI Assistant to help me with this task:
| Datalore AI Prompt |
| Write Python code to: 1. Map companies to stock symbols. 2. Fetch 2 years of quarterly financials from Polygon.io API.Implement error handling and exponential backoff. 3. Extract revenue, expenses, and net income. 4. Label quarters relative to layoff dates. 5. Combine into DataFrame, remove duplicates, sort.Print summary, save to CSV.Log missing data. 6. Use requests, pandas, and logging. Assume layoff dates in ‘df’. |
With our financial data successfully retrieved, the next step is to preprocess and visualize this data for analysis.
Let’s perform the following tasks:
- Ensure all date fields are in the correct datetime format.
- Handle any missing values in our dataset by filling them with zeros.
- Define a time range for our analysis, focusing on a two-year period leading up to the most recent data point.
- Create visualizations of key financial metrics (Revenue, Operating Expenses, and Net Income) for each company, with layoff dates clearly marked.
Here is an example of a prompt that you could use to get the Datalore AI Assistant to write the necessary code:
| Datalore AI Prompt |
| Write Python code to: 1. Preprocess financial_df: convert dates, fill missing values. 2. Extract layoff dates from df. 3. Define 2-year analysis period. 4. Create function to plot Revenue, Operating Expenses, and Net Income for each company, marking layoff dates. 5. Format plots (billions, titles, legends). 6. Generate and display plots for all companies. |
By providing sufficient instruction and through working with the LLM to get the correct prompt, Datalore is able to generate nearly one hundred lines of code that would have otherwise taken me many hours to write. The generated code can be found in this Datalore report.
Financial impact analysis: tech giants’ performance post-layoffs
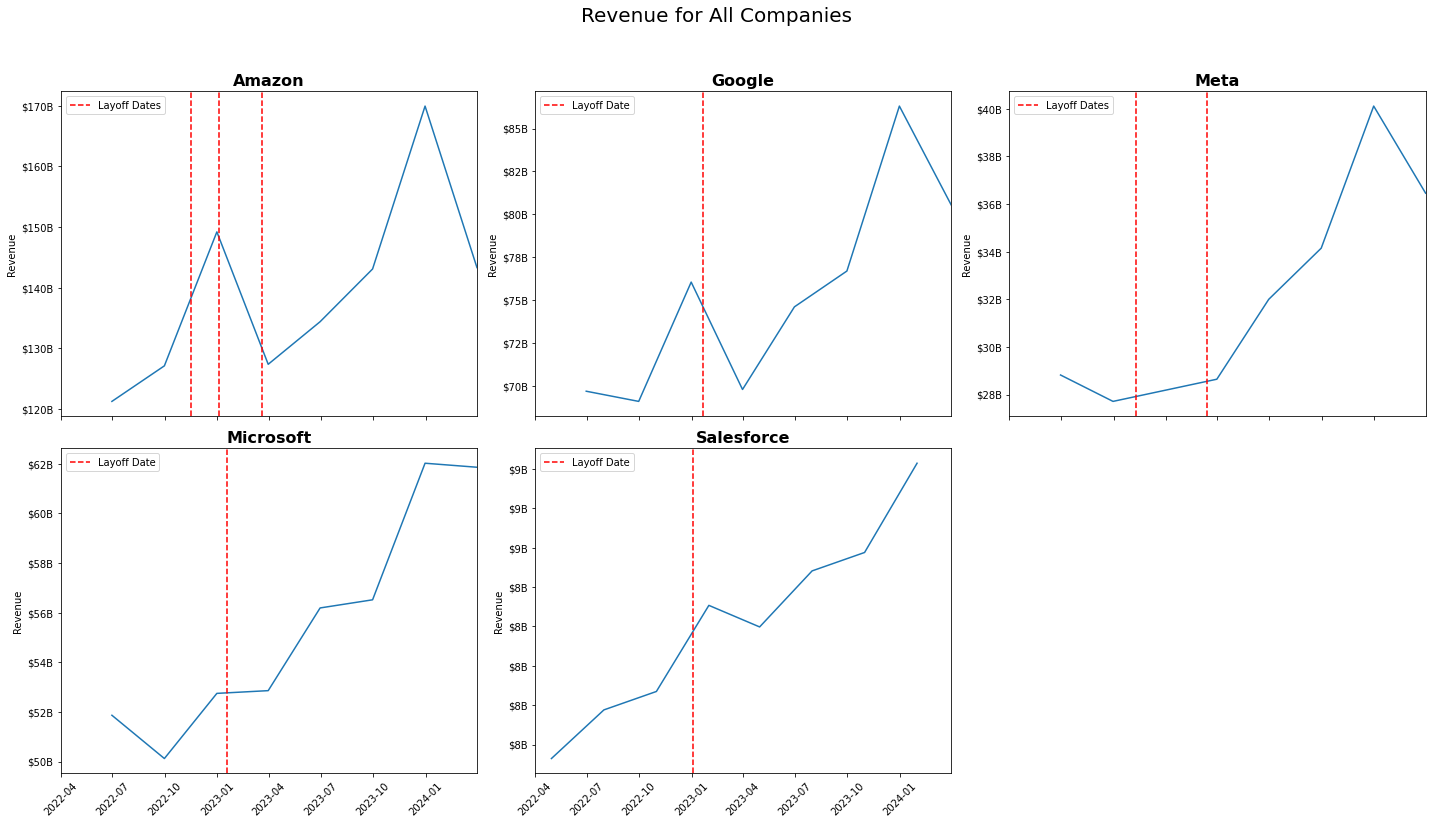
Having created graphs showcasing the quarterly financials over the past two years for Meta, Amazon, Salesforce, Google, and Microsoft, we can now analyze the impact of their significant layoffs on key financial metrics. We hypothesized that while layoffs should decrease operating expenses, they might also lead to a fall in revenue due to potential reductions in product or service quality. Let’s examine our findings:
Revenue trends
Contrary to our initial hypothesis, all five companies experienced notable revenue growth post-layoffs. This unexpected trend could be attributed to several factors:
- Broader economic recovery: The tech sector may have benefited from overall economic improvements.
- The AI boom: The surge in AI technologies, particularly with GPT-4’s release in March 2023, likely drove increased interest and investment in these companies.
- Strategic refocusing: Layoffs may have allowed these companies to streamline operations and focus on high-revenue-generating areas.
It’s worth noting that Google and Amazon experienced slight quarter-over-quarter revenue dips in Q1 2023 immediately following their layoffs, but they quickly rebounded. This temporary downturn could be attributed to short-term disruptions from the workforce reductions.
Operating expenses (OpEx)
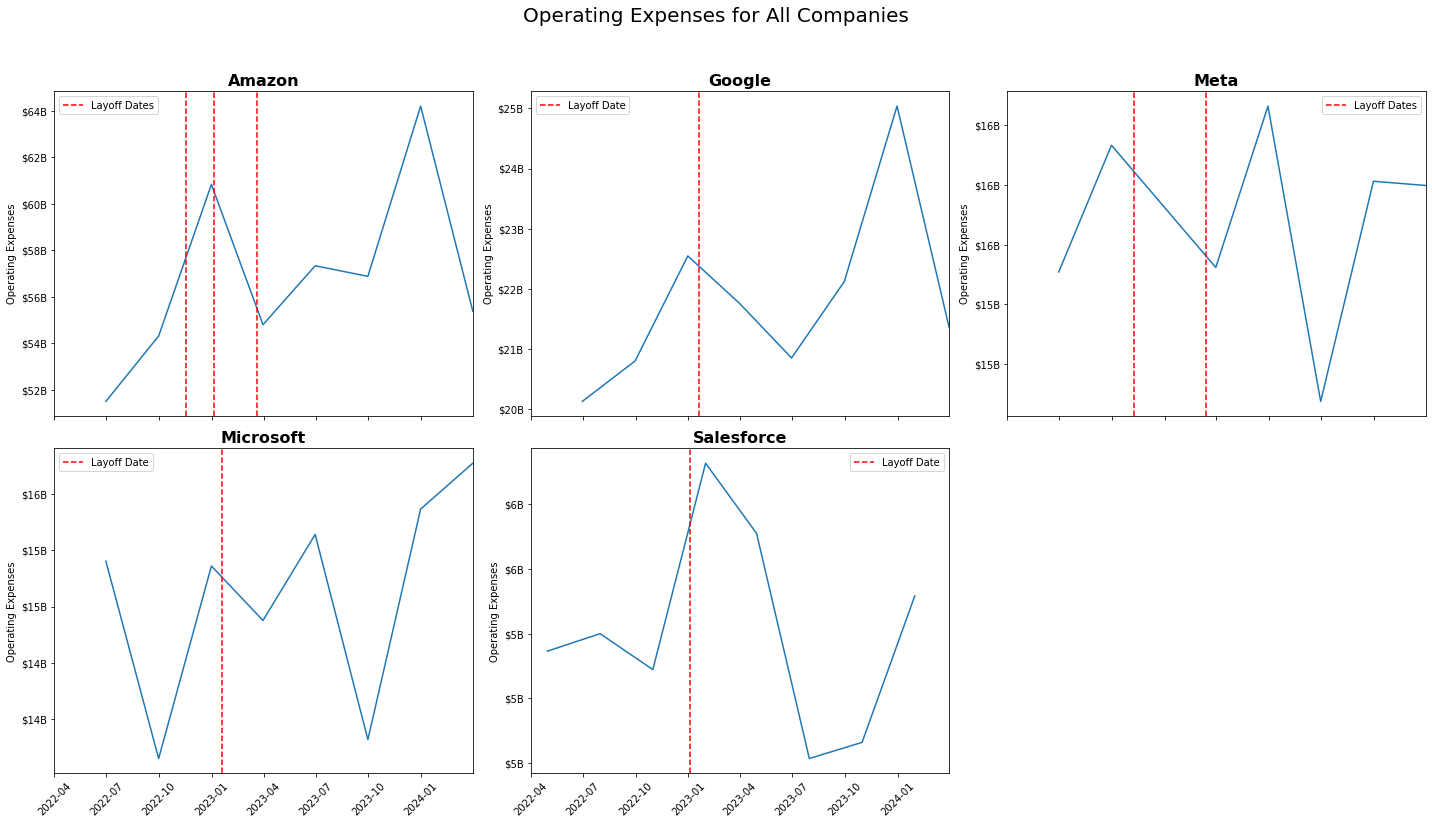
The impact on operating expenses varied among the companies:
- Amazon and Google: Both demonstrated clear reductions in OpEx, with lower expenses in four out of five quarters post-layoffs compared to Q4 2022.
- Meta and Microsoft: OpEx remained relatively stable pre- and post-layoffs, suggesting that cost savings from reduced headcount may have been reallocated to other areas.
- Salesforce: Showed the most dramatic OpEx reduction post-layoffs, after an initial spike in Q1 (possibly due to severance payouts).
For Meta and Microsoft, further analysis of specific income statement line items could reveal if increased expenditures in other areas offset the savings from reduced salaries.
Net income
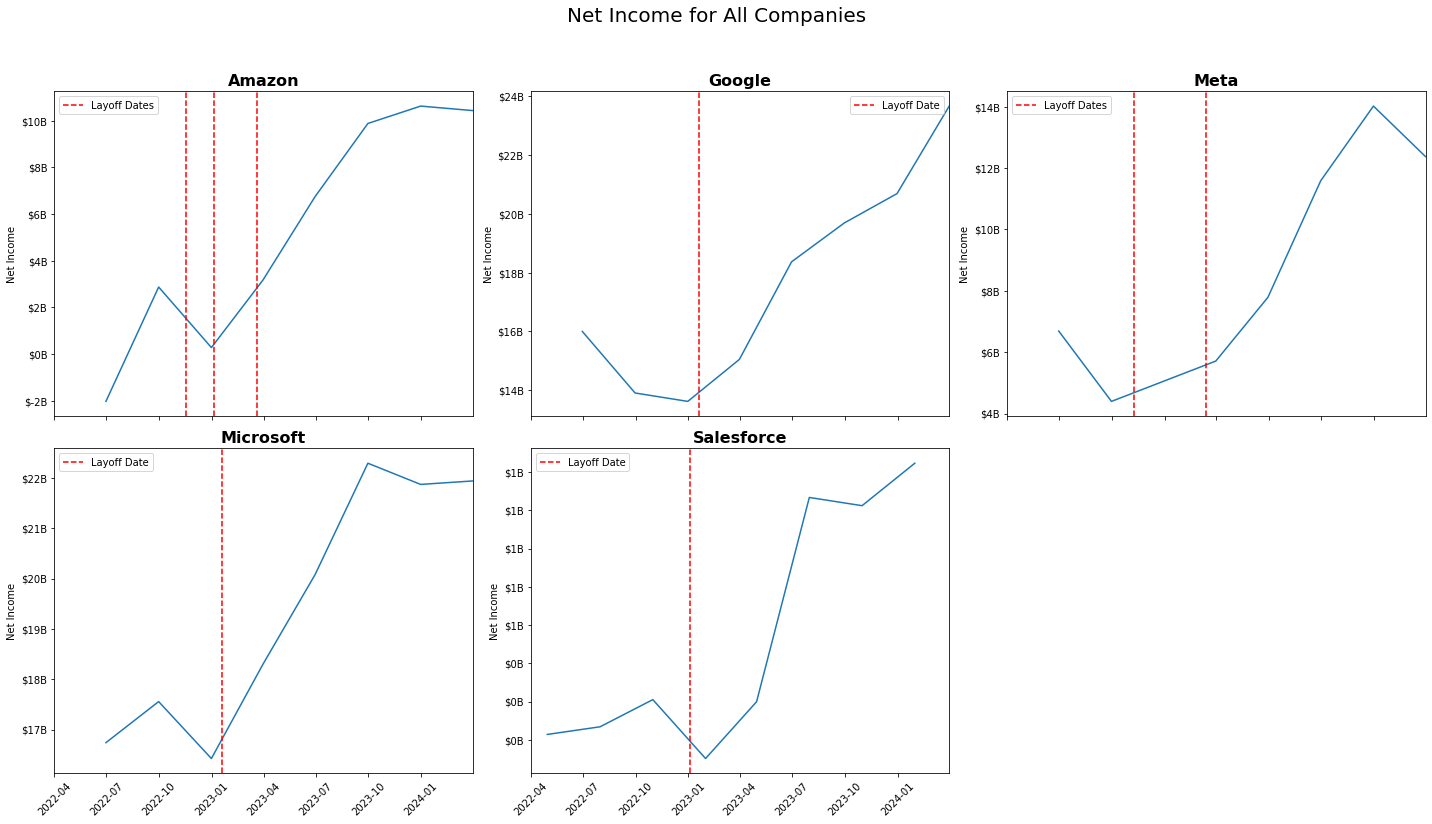
The most striking observation is the significant increase in net profits across all five companies post-layoffs. This improvement in profitability stems from:
- Increased revenues: The substantial growth in top-line figures.
- Controlled or reduced OpEx: Even in cases where OpEx didn’t decrease significantly, it didn’t grow proportionally with revenue.
Market performance comparison: tech giants vs. S&P 500
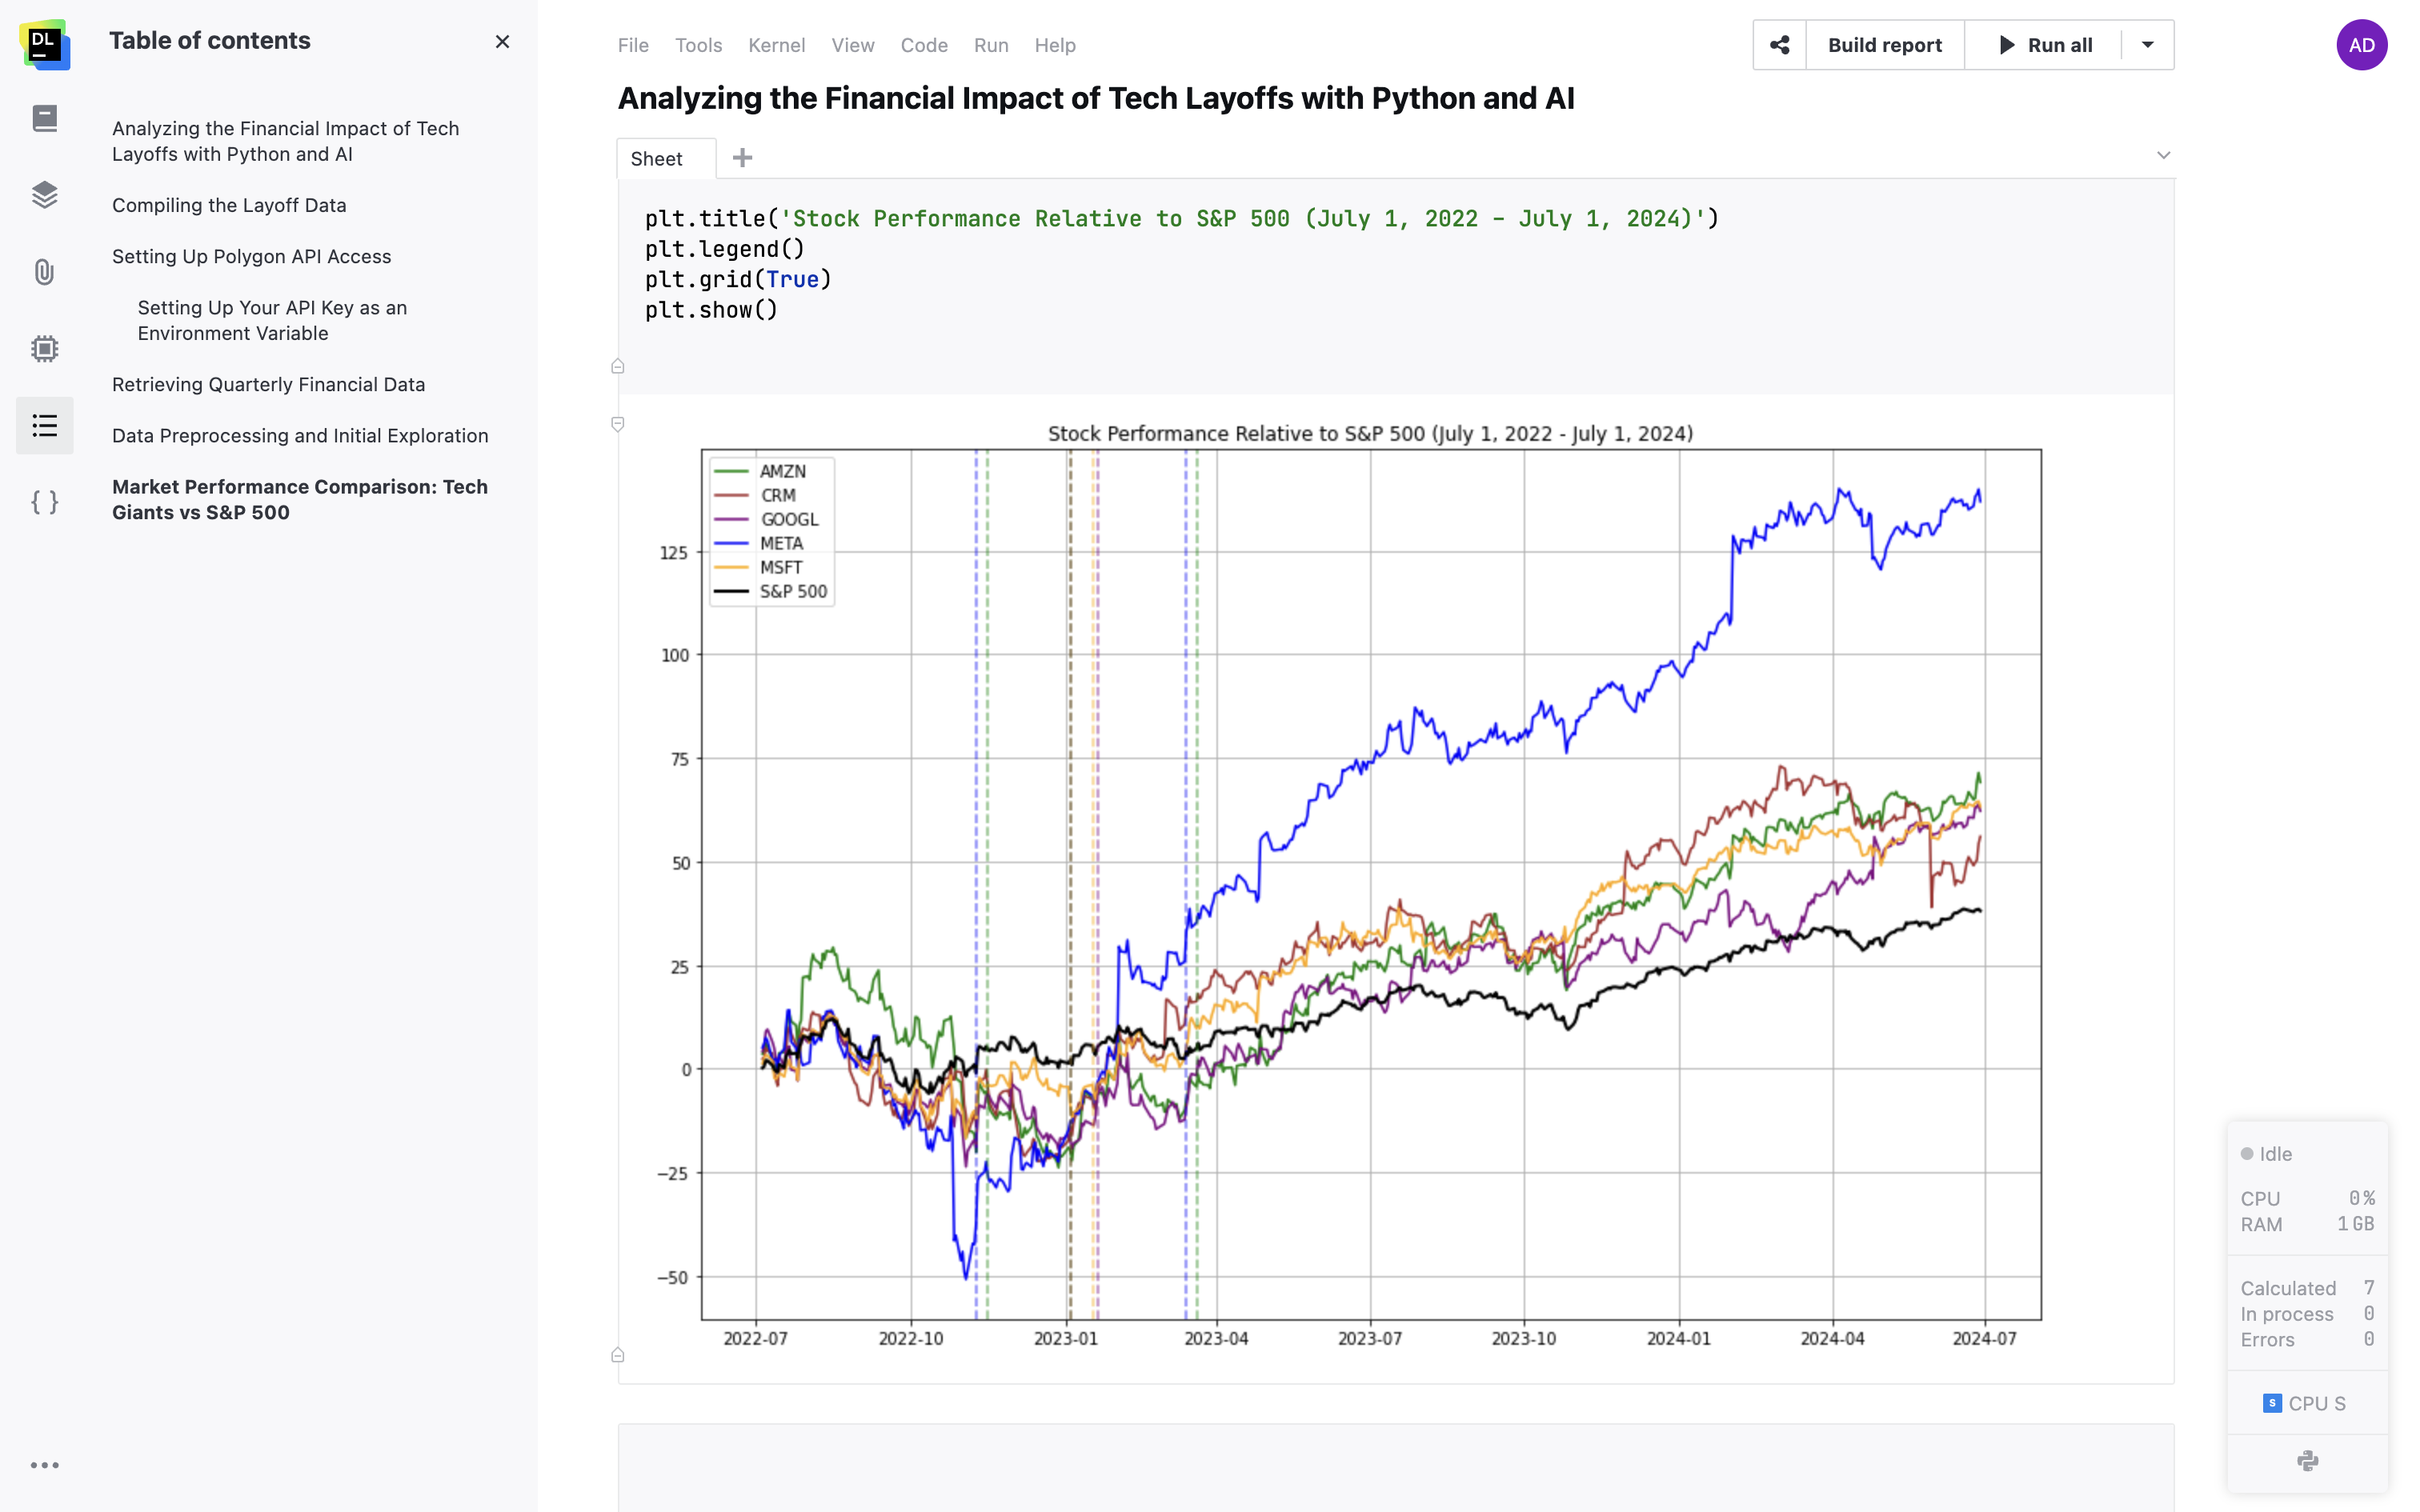
To provide a broader perspective on our analysis of tech layoffs and their financial impact, we compared the stock performance of Meta, Amazon, Microsoft, Google, and Salesforce against the S&P 500 index from July 1, 2022 (right before the layoff wave began) to July 1, 2024 (two years later). This comparison allows us to determine whether these companies outperformed the tech sector as a whole during this tumultuous period.
To source this data, we’ll pull adjusted close prices (which account for dividends and stock splits) from the free data API yfinance. You can install the yfinance package to your notebook as shown in the video below:
To get the Datalore AI Assistant to write the necessary code, you can try this prompt:
| Datalore AI Prompt |
| Create a Python script using yfinance to: 1. Fetch daily adjusted closing prices for META, AMZN, MSFT, GOOGL, CRM, and S&P 500 (^GSPC) from July 1, 2022 to July 1, 2024. 2. Calculate percentage change for each stock and the index from the start date. 3. Plot the relative performance of each stock vs S&P 500 using matplotlib. 4. Add vertical lines for layoff dates: META: 2022-11-09, 2023-03-14 AMZN: 2022-11-16, 2023-01-04, 2023-03-20 MSFT: 2023-01-18 GOOGL: 2023-01-20 CRM: 2023-01-04. 5. Calculate and print total returns for the period. 6. Use appropriate labels, legend, and formatting for the plot. |
The AI-generated code retrieved the necessary data and plotted the following graph:
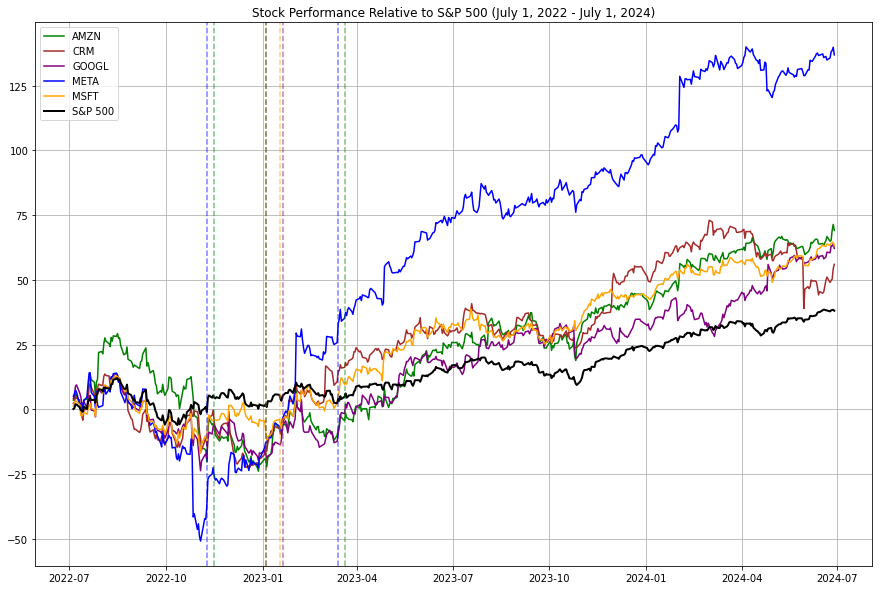
Our analysis of stock performance from July 1, 2022 to July 1, 2024 reveals several interesting trends:
- Initial underperformance: The graph clearly shows that the S&P 500 (black line) was outperforming all five tech companies when the majority of layoffs (six out of eight) occurred. This underperformance likely contributed to the companies’ decisions to implement workforce reductions, as they sought to improve their financial positions and investor perceptions.
- Post-layoff recovery: Shortly after the layoff announcements, we observe a notable trend reversal. The stock prices of all five companies began to recover, eventually outpacing the S&P 500. This suggests that the market responded positively to the cost-cutting measures, possibly viewing them as necessary steps to improve efficiency and profitability.
- Long-term outperformance: By the end of the two-year period, all five companies have significantly outperformed the S&P 500 index. This indicates that, from a stock price perspective, the layoffs and subsequent strategic shifts appear to have been effective in boosting investor confidence and company valuations.
- Varied recovery patterns: While all companies ultimately outperformed the S&P 500, their recovery trajectories differ:
- Meta (formerly Facebook) shows the most dramatic turnaround, going from the worst performer to the best.
- Amazon and Microsoft display steady, consistent growth post-layoffs.
- Google (Alphabet) and Salesforce show more gradual recoveries but still end up outperforming the index.
- Market dynamics: It’s important to note that this period coincided with a broader tech sector recovery and increasing excitement around AI technologies. These external factors likely contributed to the strong performance of these tech giants.
- Layoffs timing: The clustering of layoff announcements between November 2022 and March 2023 suggests a sector-wide response to similar market pressures. The subsequent performance indicates that these companies may have “right-sized” their operations effectively for the evolving market conditions.
While stock price is just one metric of company performance, this analysis suggests that the market viewed the layoffs and subsequent strategic shifts positively. However, it’s crucial to consider other factors, such as employee morale, long-term innovation capacity, and broader economic trends, when evaluating the full impact of these workforce reductions.
Moreover, the outperformance of these tech giants relative to the S&P 500 underscores their continued dominance and ability to adapt to changing market conditions, even in the face of significant organizational changes.
This expanded analysis provides a more detailed interpretation of the data, considering various factors and offering a balanced perspective on the observed trends.
Conclusion
While the layoffs appear to have contributed to improved profitability, it’s crucial to consider other factors at play:
- Economic cycle: The overall tech sector experienced growth during this period.
- AI emergence: The AI boom likely drove both investor interest and consumer spending.
- Strategic shifts: Layoffs may have allowed companies to refocus on core, high-profit areas.
The reduction or stabilization of OpEx can be more directly attributed to the layoffs. However, the impressive revenue growth is likely a combination of internal strategic shifts and favorable external market conditions, particularly the AI-driven tech boom of early 2023.
Further analysis could involve:
- Detailed examination of specific OpEx line items to understand the reallocation of resources.
- Comparison with industry peers who didn’t implement significant layoffs.
- Analysis of productivity metrics to assess the efficiency gains post-layoffs.
This multifaceted approach would provide a more comprehensive understanding of how these tech giants navigated the challenging balance between cost-cutting measures and maintaining growth in a rapidly evolving technological landscape.