JetBrains Academy
The place for learning and teaching computer science your way
Learn Data Analysis With Pandas and Python

As the amount of digital data continues to grow, companies increasingly rely on data analysis to make business decisions, creating a strong demand for skilled data professionals. If you are eager to use large amounts of data to reveal meaningful insights, this career path might be right for you.
In our new Pandas for Data Analysis track, you can learn how to use one of the most popular Python libraries for data analysis and visualization. Even if you are already working on machine learning or data visualization, or using spreadsheet software for data analysis, this track will help you upgrade your skills and master a powerful data toolkit.
Benefits of learning pandas for data analysis
The pandas (short for panel data) library is an open-source, high-performance Python library for data manipulation and analysis, built on top of NumPy. Because of its easy syntax and fast operations, pandas makes working with tabular data in formats such as spreadsheets or databases very convenient. The main data structures in pandas are the Series and DataFrames classes. A DataFrame is a 2D table that supports various data formats, including JSON, CSV, SQL, and XLSX. It is a great tool for flexibly representing real data with rows and columns.
On top of that, pandas integrates the functionality of the NumPy and Matplotlib packages, providing a wide range of opportunities for data analytics and visualization. All of these functionalities make Python extremely flexible and effective in data analysis.
One of the best-known IDEs, PyCharm offers useful features like code completion and inspections, project navigation, and refactorings. Thanks to JetBrains Academy’s integration with PyCharm, you can work on your projects right in the IDE, allowing you to use all of the IDE functionality to the fullest.
Prerequisites and topics covered
To start learning the pandas library, you should probably already have some basic experience with Python and be familiar with fundamental concepts like variables, lists, functions, loops, and data types. These fundamentals are all covered in our Python for Beginners track.
Once you have a firm understanding of the basics, you can move on to mastering the pandas functions. The Pandas for Data Analysis track is here to show you how to use one of the most powerful toolkits to process, summarize, analyze, and visualize big quantities of data.
In this track, you will:
✅ Grasp the fundamentals of the SkiPy, NumPy, Matplotlib, and pandas Python libraries.
✅ Learn how to create, concatenate, and merge DataFrames.
✅ Perform data operations, including grouping, transforming, and pivoting.
✅ Create the most common plots (histogram, bar plot, scatter plot, and boxplot).
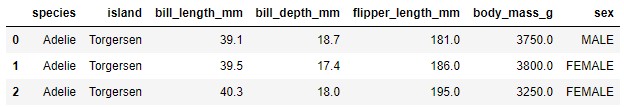
The track covers 111 educational topics. To give you an idea of what sorts of tasks you’ll be completing during the track, let’s take a look at the Data analysis with pandas topic. Here you will exercise reading the data (using read_csv) and practice the head method, looking at the first 3 lines. For this topic, we will use the Palmer Penguins dataset:
1 import pandas as pd
2 df = pd.read_csv('https://raw.githubusercontent.com/mwaskom/seaborn-data/master/penguins.csv')
1 df.head(3)
Output:
The projects you’ll build
The track offers 8 real-world projects for you to complete, allowing you to take a deep dive into data analysis with pandas. Let’s take a closer look at just a couple of them:
🏀 NBA Data Preprocessing – Challenging, ~25 hours.
Data preprocessing is one of the first and most important steps in data analysis. In this project, you will learn how to improve the quality of your input data by removing the features with low predictive value, engineering new ones, and dealing with multicollinearity. You’ll apply these concepts to NBA data to get a high-quality dataset that is ready to be fed to a linear model!
📇 HR Data Analysis – Hard, ~ 17 hours.
With this project, you will perform hands-on data analysis on 3 datasets with information about employees provided to you by the leader of a hypothetical company’s HR department. Perform several data operations and practice the pandas methods you’ve learned to reveal insights and visualize your findings.
A career to pursue after track graduation
This track will give you a solid base to pursue a career as a data professional, be it as a data analyst, business analyst, or data scientist. Regardless of what industry you choose, any company can benefit from a qualified data professional. Businesses across a range of industries are seeking ways to gather and use data to optimize operational tasks and find valuable insights.
If the idea of working in the limitless field of data science excites you, start learning data analysis with pandas today. If you have any questions or would like to share your feedback, feel free to leave a comment below or contact us at academy@jetbrains.com.
Keep learning,
Your JetBrains Academy team