Kotlin
A concise multiplatform language developed by JetBrains
K2 Compiler Performance Benchmarks and How to Measure Them on Your Projects
With the Kotlin 2.0.0 release drawing ever closer, the K2 compiler is now available for you to try! In this blog post, we explore the performance of the K2 compiler in various projects and give you the tools to collect your own performance statistics.
The road to the Stable version of the K2 compiler has been a long one. Since we made the decision to rewrite the compiler from scratch, we’ve added a new type inference algorithm, new JVM and JS IR (Intermediate Representation) backends, and finally, a new frontend.
The fundamental change in the frontend is the use of one unified data structure that contains more semantic information. This change makes compilation more efficient and helps IntelliJ IDEA analyze your Kotlin code.

The driving force behind this initiative was the desire to speed up the development of new language features, unify all platforms that Kotlin supports, and improve performance for Kotlin developers.
To receive the full benefits of the K2 compiler in IntelliJ IDEA, enable K2 Kotlin mode. The K2 Kotlin mode is in Alpha, so not all IDE features are supported yet.
Key performance improvements
- The K2 compiler brings up to 94% compilation speed gains. For example, in the Anki-Android project, clean build times were reduced from 57.7 seconds in Kotlin 1.9.23 to 29.7 seconds in Kotlin 2.0.0.
- The initialization phase is up to 488% faster with the K2 compiler. For example, in the Anki-Android project, the initialization phase for incremental builds was cut from 0.126 seconds in Kotlin 1.9.23 to just 0.022 seconds in Kotlin 2.0.0.
- The Kotlin K2 compiler is up to 376% quicker in the analysis phase compared to the previous compiler. For example, in the Anki-Android project, analysis times for incremental builds were slashed from 0.581 seconds in Kotlin 1.9.23 to only 0.122 seconds in Kotlin 2.0.0.
Set up
The Kotlin project that we used to run performance tests is available on GitHub. If you’d like to use it to collect your own statistics from your Kotlin projects, see Collect your own measurements.
Projects
We ran our performance tests on the following open-source projects:
Tools
To collect performance measurements, we used the Gradle Profiler.
We also used Kotlin build reports to collect detailed measurements about the different compilation phases.
Test scenarios
We created three scenarios to cover the most common compilation activities in a Kotlin project:
- Clean build: We built the whole project from scratch without using any pre-set configuration or build cache. This scenario happens when you compile a project for the first time or after you’ve made a project configuration change.
- Incremental build with no ABI (application binary interface) changes: We made changes in one file, but the changes were such that no further subprojects need to be recompiled.
- Incremental build with ABI changes: We made changes in one file, but these changes meant that a module needed to be recompiled because the external interface of the module was modified.
We compared performance data collected from Kotlin 1.9.23 and Kotlin 2.0.0 and used Gradle 8.5 throughout.
The Gradle configuration cache, project isolation, and build cache were disabled for all scenarios. Before the performance measurements were collected, we completed 10 warm-up rounds. We performed 10 measurement rounds in total.
Types of measurements collected
In addition to the total Kotlin compilation time and Gradle build time, our tests used build reports to collect data on the time spent by the compiler in each of its compilation phases:
| Phase | Description |
| Initialization | The compiler initializes and reads all available symbols from the compilation classpath. |
| Analysis | The compiler reads the source code, character by character, and breaks it down into meaningful tokens. These are analyzed to determine the structure of the code, after which the compiler performs semantic checks. |
| IR translation | The compiler converts the semantic information into the internal representation. |
| IR lowering | The compiler transforms the internal representation into a simpler form and finally de-sugars all special language constructs. |
| IR generation | The compiler translates the optimized internal representation into the final bytecode. |
Results
When comparing the results across our different scenarios and projects, we saw that Gradle build speeds were consistently higher by at least 9%. The most significant improvement was seen in the Anki-Android project, where the recorded build speed gains were around 20%, regardless of the compiler scenario.
| Graph with Gradle build time for clean build scenario – Anki-Android | Graphs with Gradle build time for incremental build scenarios – Anki-Android |
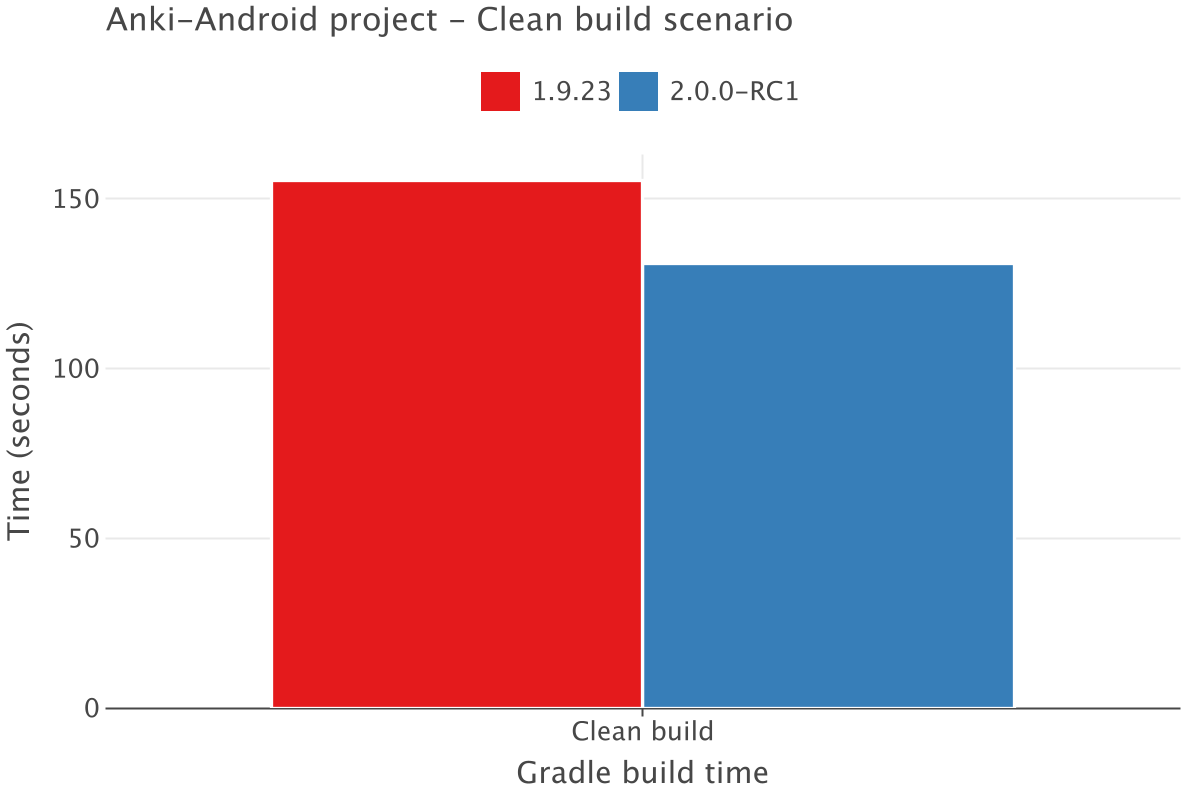 | 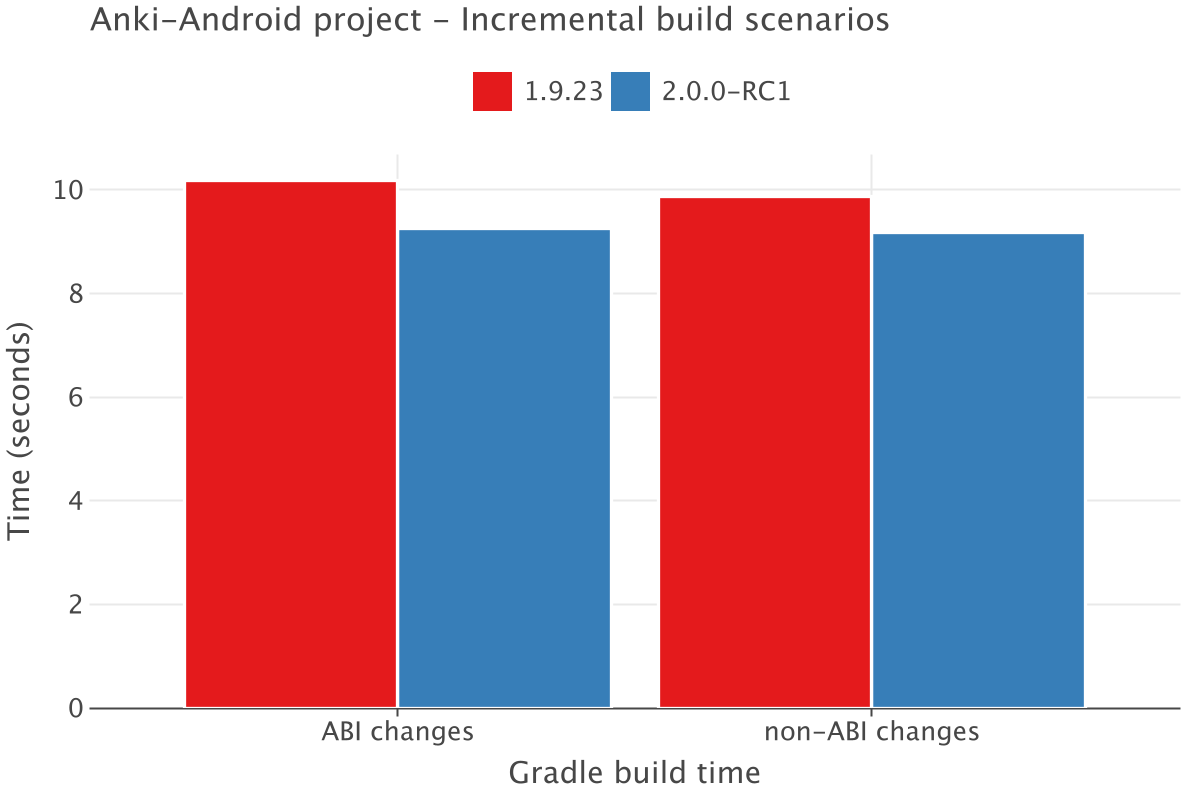 |
Clean builds
The benefits of the new K2 compiler architecture were most clearly seen in the clean build scenario, with both projects compiling significantly faster in Kotlin 2.0.0.
The Exposed project demonstrated an 80% increase in compiler speeds, with compilation times falling from 5.8 seconds in Kotlin 1.9.23 to 3.22 seconds in Kotlin 2.0.0. Similarly, the Anki-Android project showed a 94% increase in compiler performance, as compilation times were cut to 30 seconds in Kotlin 2.0.0 compared to 58 seconds in Kotlin 1.9.23.
| Graph with Kotlin compilation time for clean build scenario – Exposed | Graph with Kotlin compilation time for clean build scenario – Anki-Android |
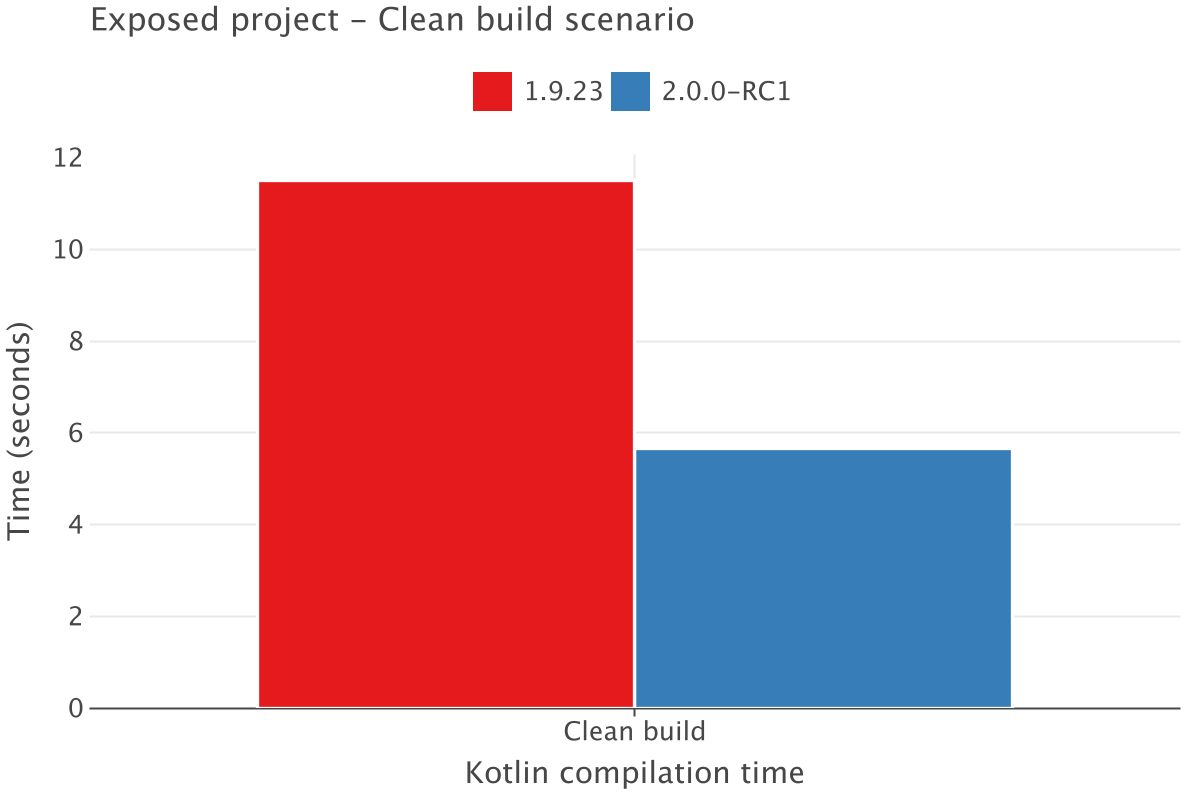 | 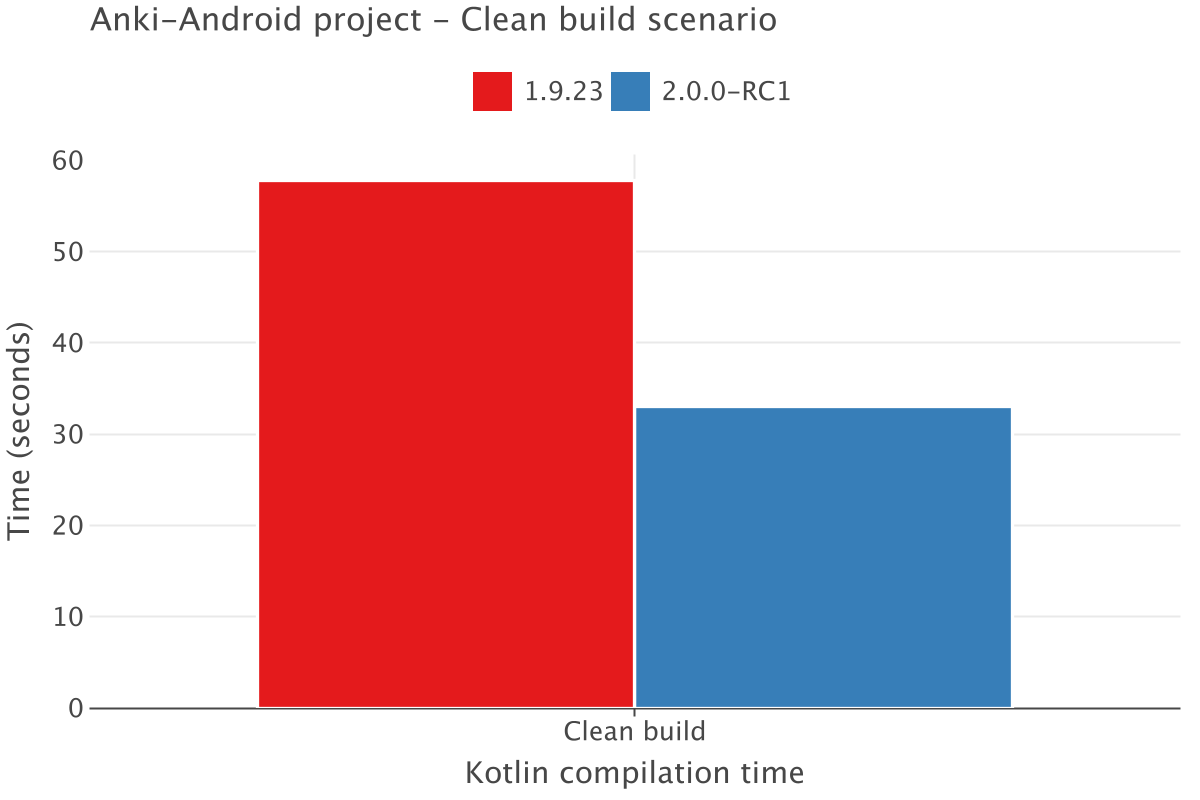 |
Delving deeper into the performance of the different compilation phases, we found that the biggest improvement came in the analysis phase, with the Exposed and Anki-Android projects reporting speed gains of 156% and 194%, respectively. This is a direct result of the new unified data structure that we implemented in the K2 frontend. Since the new compiler only has to manage one data structure instead of two and has additional semantic information available to it, it’s unsurprising that we saw such an improvement here.
| Graph with compilation breakdown for clean build scenario – Exposed |
 Blue = analysis phase |
| Graph with compilation breakdown for clean build scenario – Anki-Android |
 Blue = analysis phase |
Incremental builds
For the incremental build scenarios, we also saw improved compiler performance. Especially in the case of the Anki-Android project, where compilation speeds increased by as much as 275% for both incremental build scenarios.
| Graph with Kotlin compilation time for incremental build scenarios – Anki-Android |
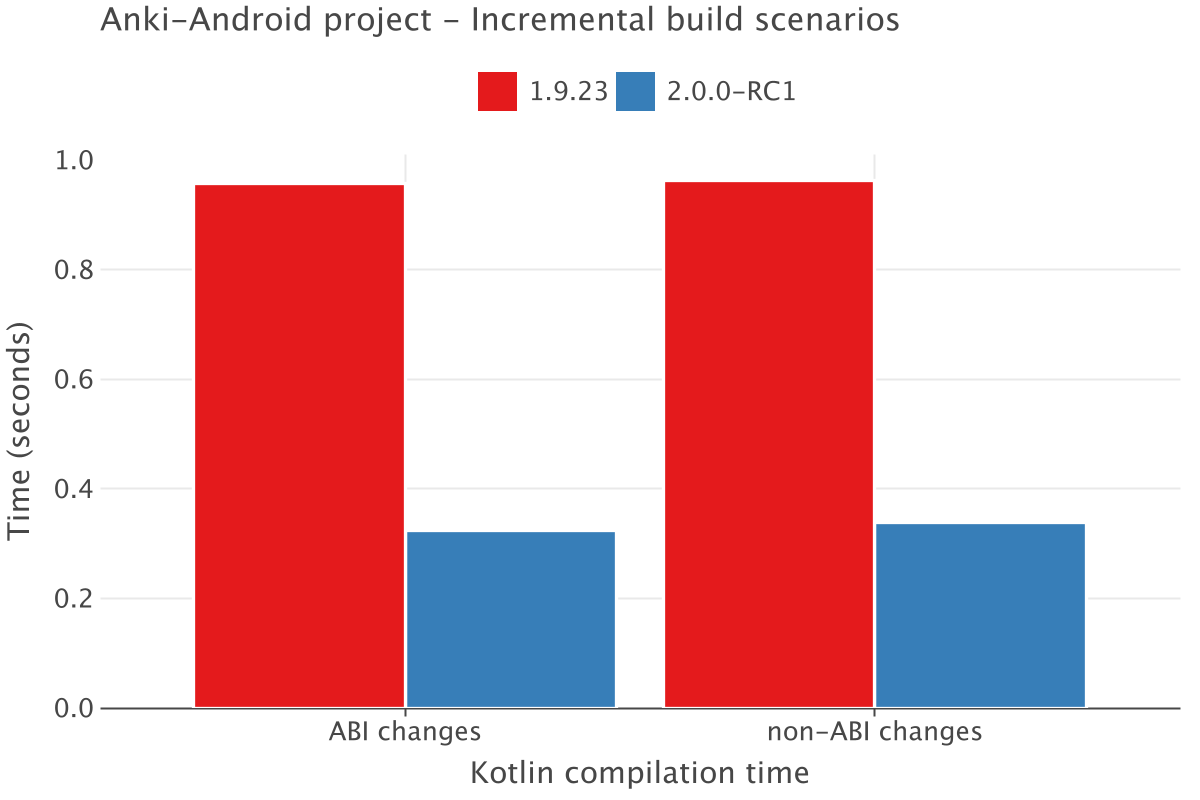 |
However, the results for the Exposed project weren’t as impressive. We saw a gain of just 35% for incremental builds with ABI changes and 7% for incremental builds without ABI changes, so there’s still room for improvement in this area.
While investigating the performance of the different compilation phases, we observed that the biggest performance gains were in the initialization and analysis phases, with each becoming around 400% faster in the Anki-Android project.
| Graph with compilation breakdown for incremental build for ABI scenario – Anki-Android |
 |
| Graph with compilation breakdown for incremental build for non-ABI scenario – Anki-Android |
 |
Again, the Exposed project demonstrated a smaller improvement in the initialization and analysis phases, with a relatively modest 12%–55% performance boost. In fact, in the case of incremental builds with ABI changes in the IR lowering and IR generation phases, there was actually a performance degradation. However, the time taken in these phases is so little to begin with that we believe the impact to be imperceptible. For example, the IR lowering phase takes 0.01 seconds in Kotlin 1.9.23, rising to 0.014 seconds in Kotlin 2.0.0.
Collect your own measurements
As we edge closer to the release of Kotlin 2.0.0, the spotlight is firmly on the K2 compiler, and it’s your turn to put it to the test. This section guides you through collecting your own Kotlin project performance statistics.
To facilitate an easy and quick benchmarking process for your own Kotlin projects, we’ve prepared a performance management tool especially for you. This is a Kotlin-based project that allows you to gather performance measurements for any Kotlin project, local or remote. You have the option to customize your own test scenarios as required. For visualization purposes, you can analyze the raw data generated by these scenarios, or use the provided Kotlin notebook for a more convenient visual representation.
Prerequisite
Ensure beforehand that the project that you want to analyze can be successfully compiled with both Kotlin versions that you want to compare. By default, this project uses Kotlin 1.9.24 and Kotlin 2.0.0-RC3.
Step 1: Open the project in IntelliJ IDEA
- Clone the k2-performance-metrics repository.
- Download and install the latest version of IntelliJ IDEA.
- On the IntelliJ IDEA welcome screen, click Open or select File | Open in the menu bar.
- Navigate to the
k2-performance-metricsfolder and click Open.
Step 2: Set up your project
- Verify environment variables:
- Confirm that the
JAVA_HOMEvariable is set, as it will be used to compile your project. - Ensure that
ANDROID_HOMEis set if your project involves Android development.
- Confirm that the
- In the
gradle.propertiesfile, add the project that you want to collect measurements for in one of the following ways:- Add the local path in
project.path.
- Add the GitHub URL in
project.git.urland the commit that you want the tests to run from inproject.git.commit.sha.
- Add the local path in
- So that the Kotlin version can be automatically configured for your project, in your
build.gradle(.kts)file, add the$kotlin_versionparameter:
plugins {
    id("org.jetbrains.kotlin.jvm") version "$kotlin_version"
}
- If your project uses a version catalog, update the
settings.gradle.ktsfile to override the Kotlin version using the following code:
versionCatalogs {
    create("libs") {
        val kotlinVersion = System.getenv("kotlin_version")
        if (kotlinVersion != null) {
            version("kotlin", kotlinVersion)
        }
    }
}
- For the incremental build scenarios, add the path to the file where you’re making changes:
scenario.abi.changesfor the incremental build with ABI changes scenario.scenario.non.abi.changesfor the incremental build without ABI changes scenario.
- If dependency verification is enabled, ensure that the dependencies for both Kotlin
1.9and Kotlin2.0are correctly included in your project setup. Alternatively, you can disable dependency verification. - If you are using the
kotlinDslplugin in thebuildSrcsubproject, we recommend applying thekotlin("jvm")plugin as well. This prevents issues related to unrecognized output types, such as the new JSON format for build reports available from Kotlin 1.9.23 and Kotlin 2.0.0-RC1, and ensures compatibility across your project’s configuration.
Step 3: Collect measurements
- In IntelliJ IDEA, open the Gradle tool window by selecting View | Tool Windows | Gradle.
- In Tasks | benchmarks, select and run the runBenchmarks task.

Alternatively, you can run the following command in the terminal from the k2-performance-measurement root directory:
./gradlew runBenchmarks
By default, the build reports are available in the reports/{kotlin-version}/{scenario-name} folders.
If you want to create your own custom test scenarios, you can do so by extending the task class in your build.gradle.kts file. For more information, see the Create custom build scenarios section in the k2-performance-metrics repository’s README.md.
Step 4: Analyze your results with Kotlin Notebook
You need IntelliJ IDEA Ultimate to use Kotlin notebooks.
- In IntelliJ IDEA, go to Settings/Preferences | Plugins and select the Marketplace tab.
- In the search bar, search for “Kotlin Notebook” and select Install.
- Open
benchmarkResult.ipynband click theRun Allbutton in the gutter to run all cells.

Conclusion
In summary, the new K2 compiler architecture can significantly reduce compilation times in your projects. This is particularly true for clean builds and the analysis phase of compilation, though Gradle build times are also shortened by the new compiler. Nevertheless, the degree of improvement that you’ll see will depend on your specific project. Some projects may enjoy a considerable increase in performance, while others may only experience modest gains.
Throughout our time working on the new K2 compiler, we’ve been constantly testing its performance on our internal projects. Additionally, EAP champions and early adopters have been testing it on their own projects, providing invaluable feedback on its performance and usability.
Now, we’re asking you to try the K2 compiler and provide your feedback. We encourage you to join our public Slack (get your invite here) for support and discussions. If you’re facing specific problems or bugs, please don’t hesitate to create an issue in the Kotlin YouTrack project. Your feedback is invaluable in refining K2 and ensuring it meets the high standards and needs of our community.
What else to read and watch
- K2 Compiler Migration Guide
- K2 Kotlin Mode (Alpha) in IntelliJ IDEA
- What Everyone Must Know About The New Kotlin K2 Compiler
- The K2 Compiler Is Going Stable in Kotlin 2.0


