This tutorial was written by an external contributor.
Kevin Kimani
Kevin Kimani is a software engineer and technical writer with over three years of experience in software development and documentation. He works across full-stack web development, database design, RESTful API development, and technical writing for engineer audiences. His writing focuses on clear API documentation, tutorials, and how-to guides that help developers understand and use products more easily.
As a developer, logging is usually the first technique that you reach for when something goes wrong in your application. You add a few log statements at the start and end of a function and in the exception handlers, and then you get a basic picture of what your application is doing. For simple services that run on a single instance, this approach is usually enough. You can just go through the log file, spot the error, and trace it back to its cause in just a few minutes.
But as your systems grow, that same approach doesn’t work. Logs start to pile up from multiple sources, executions interleave, and the error you’re looking at in the logs doesn’t provide enough information. You can clearly see the error, but you can’t trace it back to what caused it.
In this tutorial, you’ll learn how to move beyond basic logging by instrumenting a Kotlin and Spring Boot backend service with OpenTelemetry. You’ll learn how OpenTelemetry’s tracing model gives you the execution context that logs alone can’t provide. By the end of this guide, you’ll have a working instrumented service and a clear mental model for building more observable backend systems.
Why You Need Next-Level Observability
Modern backend systems are rarely linear. One operation might fan out to several downstream services, retry on failure, or execute concurrently across multiple instances and threads. All these patterns create opportunities for failure that might be hard to explain after the fact. When a background job that processes hundreds of records across overlapping executions errors out, your logs won’t tell you much. You won’t be able to explain which execution the error belonged to or whether the other executions succeeded or failed in the same way.
The lack of execution context creates a gap between seeing the error in your logs and actually understanding what happened leading to it. You just have the error message and a timestamp, but no way to connect it to the broader execution that it belongs to. In a system that runs multiple concurrent job executions, logs from different runs always interleave freely, and thread names get reused by the thread pool. Without a way to uniquely identify each execution, each line of text in your log file is an isolated fact without any reliable way to group it with others that belong to the same run.
Observability gives you a structured view of what your system did and in what order. It does this through traces, which are records of complete operations that contain unique identifiers. You can easily filter your logs by these trace identifiers, and you’ll be able to see the entire history of a specific execution clearly. Metrics add another dimension by revealing patterns over time that no single log entry can show. Together, they help to transform debugging from guesswork into a structured investigation.
What OpenTelemetry Provides
OpenTelemetry is an open-source observability framework that defines a unified model for collecting three types of signals from your applications:
Traces: represent the full lifecycle of a request or an operation as it moves through your system. A trace is made up of spans, where each span represents a unit of work within the operation, such as an HTTP call or a background task. Each span contains a trace ID and a span ID as part of its context, where the trace ID ties back the span to its parent operation (trace) and the span ID uniquely identifies the single specific step within the operation.
Metrics: capture aggregated measurements over time, such as how long an operation takes and the error rates. This helps to give you a statistical view of the overall system health.
Logs: represent discrete events that happened at a specific point in time. When correlated with trace context, logs stop being isolated entries in a file and become anchored events within a specific execution, which makes it easy to understand exactly what happened and why.
The OpenTelemetry ecosystem consists of three main components:
Instrumentation
The Collector
Exporters
Instrumentation is how you integrate OpenTelemetry into your application. It uses language-specific SDKs that implement the OpenTelemetry API for creating spans, recording metrics, and propagating the context.
The Collector is an optional but powerful middleware component that defines the logic for receiving, processing, and exporting telemetry data to one or more supported backends.
The exporters are plugins that send your application’s telemetry data to a specific destination, such as Prometheus, Jaeger, or any other compatible backend.
What makes OpenTelemetry a valuable long-term observability strategy is its vendor neutrality. Before OpenTelemetry, instrumentation was tightly coupled to specific vendors, and switching always meant that you needed to rewrite your instrumentation code throughout the entire codebase. OpenTelemetry fixed this by separating the instrumentation from the destination. This means that you can now instrument your service once using the standard API and then change the exporters as your infrastructure and specific requirements evolve.
Repository with the companion code for the tutorial
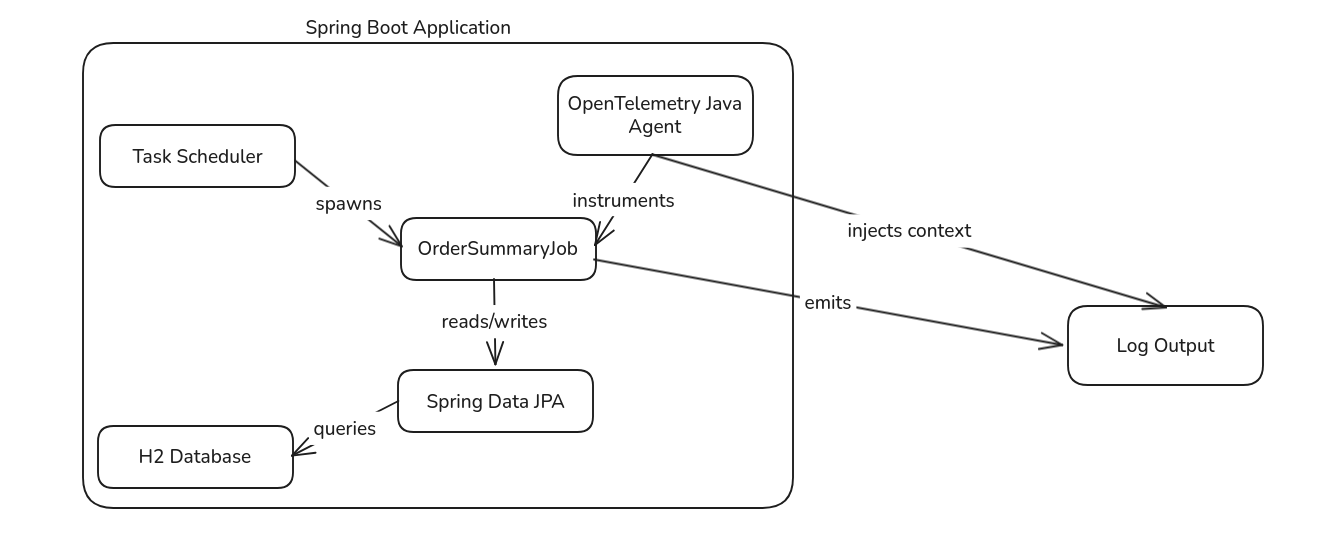
Here is a rough architecture diagram of what you’ll build in this guide:
The application consists of a Spring Boot Service running in a single Java Virtual Machine (JVM). The Task Scheduler triggers the OrderSummaryJob at regular intervals. The job reads orders from an embedded H2 database via Spring Data JPA, processes them, and writes summaries back to the database. The OpenTelemetry Java Agent sits within the JVM, automatically instrumenting the job and injecting trace context into the Mapped Diagnostic Context (MDC). This context flows through the log output, allowing you to correlate all logs from a single execution when multiple executions run concurrently.
Now that you have the prerequisites and understand the system you will build, it’s time to get started.
Setting Up the Starter Template
To keep this tutorial focused on adding observability, we’ve prepared a Kotlin and Spring Boot application that runs a scheduled job every few minutes. Clone the application to your local machine by executing the following command:
The most important file in this project is the src/main/kotlin/com/example/order_summary/service/OrderSummaryJob.kt, which defines the scheduled job. The job reads orders created in the last 24 hours from an H2database via Spring Data repositories, processes them one by one, and writes summaries back to the DB. The job runs every five minutes using Spring’s @Scheduled annotation. The summaries generated by this job can later be consumed by other parts of a larger system, such as dashboards, analytic pipelines, or downstream services that need a periodic snapshot of order volume and revenue.
Since this tutorial’s main focus is on observability, let’s review the logging approach used in this job:
@Service
class OrderSummaryJob(
   private val orderRepository: OrderRepository,
   private val orderSummaryRepository: OrderSummaryRepository
) {
   private val logger = LoggerFactory.getLogger(OrderSummaryJob::class.java)

   @Scheduled(fixedDelay = 300000) // 5mins in ms
   fun generateSummary() {
       logger.info("Starting order summary job...")

       val periodEnd = LocalDateTime.now()
       val periodStart = periodEnd.minusHours(24)

       val orders = orderRepository.findByCreatedAtAfter(periodStart)
       if (orders.isEmpty()) {
           logger.info("No orders found in the last 24 hours. Skipping summary generation.")
           return
       }
       logger.info("Found ${orders.size} orders to process")

       var processedCount = 0
       var totalAmount = BigDecimal.ZERO

       for (order in orders) {
           try {
               logger.info("Processing order ${order.id} for customer ${order.customerId}...")

               // Simulate processing work
               Thread.sleep(2000)

               // Simulate occasional failures
               if (order.amount > BigDecimal("400")) {
                   throw RuntimeException("Order amount exceeds threshold: ${order.amount}")
               }

               totalAmount = totalAmount.add(order.amount)
               processedCount++
           } catch (e: Exception) {
               logger.error("Failed to process order ${order.id}: ${e.message}")
               // Continue processing other orders
           }
       }

       val summary = OrderSummary(
           totalOrders = orders.size,
           totalAmount = totalAmount,
           periodStart = periodStart,
           periodEnd = periodEnd
       )

       orderSummaryRepository.save(summary)
       logger.info("Order summary job completed. Total: ${orders.size} orders, Amount $totalAmount")
   }
}
As you can see, the logging approach is straightforward and very common. You log when the job starts, log each order being processed, log if an exception occurs, and log when the job finishes.
To see it in action, run the following command in your terminal:
./gradlew bootRun
Once the application starts, you can see the logs. Execute the command tail -f logs/order-summary.log in a separate terminal to stream the logs from the configured log file:
2026-02-24T15:49:47.304+03:00  INFO 605417 --- [order-summary] [scheduling-1] c.e.o.service.OrderSummaryJob            : Found 12 orders to process
2026-02-24T15:49:47.305+03:00  INFO 605417 --- [order-summary] [scheduling-1] c.e.o.service.OrderSummaryJob            : Processing order 1 for customer CUST-10001...
2026-02-24T15:49:49.306+03:00  INFO 605417 --- [order-summary] [scheduling-1] c.e.o.service.OrderSummaryJob            : Processing order 3 for customer CUST-10003...
2026-02-24T15:49:51.307+03:00  INFO 605417 --- [order-summary] [scheduling-1] c.e.o.service.OrderSummaryJob            : Processing order 7 for customer CUST-10007...
2026-02-24T15:49:53.308+03:00  INFO 605417 --- [order-summary] [scheduling-1] c.e.o.service.OrderSummaryJob            : Processing order 8 for customer CUST-10008...
2026-02-24T15:49:55.308+03:00  INFO 605417 --- [order-summary] [scheduling-1] c.e.o.service.OrderSummaryJob            : Processing order 9 for customer CUST-10009...
2026-02-24T15:49:57.310+03:00 ERROR 605417 --- [order-summary] [scheduling-1] c.e.o.service.OrderSummaryJob            : Failed to process order 9: Order amount exceeds threshold: 458.23
...

2026-02-24T15:50:11.322+03:00 ERROR 605417 --- [order-summary] [scheduling-1] c.e.o.service.OrderSummaryJob            : Failed to process order 19: Order amount exceeds threshold: 427.98
2026-02-24T15:50:11.340+03:00  INFO 605417 --- [order-summary] [scheduling-1] c.e.o.service.OrderSummaryJob            : Order summary job completed. Total: 12 orders, Amount 1680.31
The logs show clean, linear execution. Each step follows the previous one, and errors are easy to associate with the work being performed. This works well when the job runs infrequently, and only a single instance of the application is deployed. One execution completes before the next begins, so tracing failures back to their source is straightforward. For early-stage systems, this level of logging is sufficient.
Introducing Complexity
As a project evolves, two changes might occur:
The business might demand near real-time visibility into the order metrics, which means that the job needs to run more frequently. Say, every five seconds instead of every five minutes.
The application may be deployed across multiple instances for high availability.
Let’s start by running the job more frequently to see how this affects our current logging approach. To do this, open the src/main/kotlin/com/example/order_summary/OrderSummaryApplication.kt file and add the following line of code to the main application class:
@EnableAsync
This enables async execution. Remember to add the following import statement to the same file:
Next, open the src/main/kotlin/com/example/order_summary/service/OrderSummaryJob.kt file and replace @Scheduled(fixedDelay = 300000) // 5mins with the following:
@Async
@Scheduled(fixedRate = 5000) // 5secs in ms
Changing from fixedDelay to fixedRate means the job starts every five seconds regardless of whether the previous execution has finished. Adding @Async ensures that each execution runs on its own thread from Spring’s task executor pool, preventing slow jobs from blocking the scheduler. This is a common pattern when scaling background jobs to handle higher throughput.
Remember to add the following import statement to the same file:
Restart the application and observe the logs. You should see something like this:
2026-02-24T16:17:40.469+03:00  INFO 610799 --- [order-summary] [task-1] c.e.o.service.OrderSummaryJob            : Starting order summary job...
2026-02-24T16:17:40.596+03:00  INFO 610799 --- [order-summary] [task-1] c.e.o.service.OrderSummaryJob            : Found 12 orders to process
2026-02-24T16:17:40.597+03:00  INFO 610799 --- [order-summary] [task-1] c.e.o.service.OrderSummaryJob            : Processing order 1 for customer CUST-10001...
...
2026-02-24T16:17:47.468+03:00  INFO 610799 --- [order-summary] [task-2] c.e.o.service.OrderSummaryJob            : Processing order 3 for customer CUST-10003...
2026-02-24T16:17:48.602+03:00  INFO 610799 --- [order-summary] [task-1] c.e.o.service.OrderSummaryJob            : Processing order 9 for customer CUST-10009...
2026-02-24T16:17:49.469+03:00  INFO 610799 --- [order-summary] [task-2] c.e.o.service.OrderSummaryJob            : Processing order 7 for customer CUST-10007...
2026-02-24T16:17:50.460+03:00  INFO 610799 --- [order-summary] [task-3] c.e.o.service.OrderSummaryJob            : Starting order summary job...
2026-02-24T16:17:50.472+03:00  INFO 610799 --- [order-summary] [task-3] c.e.o.service.OrderSummaryJob            : Found 12 orders to process
2026-02-24T16:17:50.473+03:00  INFO 610799 --- [order-summary] [task-3] c.e.o.service.OrderSummaryJob            : Processing order 1 for customer CUST-10001...
...
2026-02-24T16:17:54.476+03:00  INFO 610799 --- [order-summary] [task-3] c.e.o.service.OrderSummaryJob            : Processing order 7 for customer CUST-10007...
2026-02-24T16:17:54.608+03:00  INFO 610799 --- [order-summary] [task-1] c.e.o.service.OrderSummaryJob            : Processing order 14 for customer CUST-10014...
2026-02-24T16:17:55.460+03:00  INFO 610799 --- [order-summary] [task-4] c.e.o.service.OrderSummaryJob            : Starting order summary job...
2026-02-24T16:17:55.473+03:00  INFO 610799 --- [order-summary] [task-4] c.e.o.service.OrderSummaryJob            : Found 12 orders to process
2026-02-24T16:17:55.474+03:00  INFO 610799 --- [order-summary] [task-4] c.e.o.service.OrderSummaryJob            : Processing order 1 for customer CUST-10001...
2026-02-24T16:17:55.475+03:00 ERROR 610799 --- [order-summary] [task-2] c.e.o.service.OrderSummaryJob            : Failed to process order 9: Order amount exceeds threshold: 458.23
The logs are now completely interleaved. Executions from task-1, task-2, and task-3 are all running simultaneously, processing the orders, and logging to the same output. When an error occurs, like the failure on order 9 at 16:17:55, it’s not easy to figure out which job execution the log belongs to and which orders were successfully processed before the error occurred in that specific execution.
You might think searching by thread name, such as task-1, would solve this, but Spring’s thread pool reuses threads. After task-1 finishes its first execution, it picks up execution 9, then execution 17, and so on. Searching by thread name now gives you mixed logs from multiple unrelated executions. In production, where multiple application instances run behind a load balancer, thread names are no longer unique across your system.
This is where plain logging breaks down. You know and see that something failed, but you can’t explain what happened leading up to it.
A Better Solution: Adding OpenTelemetry
To address the missing execution context, let’s adapt the application to use OpenTelemetry for log correlation. The goal is not to analyze the performance or optimize the job, but to fix the issue of associating logs with their execution context. Each job execution will be treated as a logical unit of work. A unique trace ID will be attached to that execution, and all logs emitted during the job will include that ID. This way, even when multiple executions run concurrently, and your logs get interleaved, you can filter them by trace ID and see exactly what happened in a single run from the start to the end.
OpenTelemetry provides several ways to instrument applications. In this guide, we’ll use the Java Agent, which automatically instruments your application without requiring any changes to the source code.
Let’s start by downloading the agent JAR file. Execute the following commands in the project root folder to create a directory for the agent and download it:
Add the agents/ directory to your .gitignore file so that the JAR file is not committed to version control. You can use the command echo "agents/" >> .gitignore or add it manually.
Once you’ve confirmed that the agent was downloaded successfully, it’s time to configure it. You need to attach it to the JVM when running the application by passing it as an argument. Open the build.gradle.kts file and add the following configuration:
-javaagent tells the JVM to load the OpenTelemetry agent before your application starts
-Dotel.service.name sets the name of your service in the telemetry data
-Dotel.traces.exporter=logging prints trace data to the console. No external backend is needed for this guide
-Dotel.metrics.exporter=none and -Dotel.logs.exporter=none disable metrics and log exporting since that is outside the scope of this guide
Lastly, you need to update the log patterns to include trace context. The OpenTelemetry agent automatically injects trace_id and span_id into the logging context (Mapped Diagnostic Context). To display these values in your application logs, open the src/main/resources/application.properties file and add the following:
The %mdc{trace_id} and %mdc{span_id} directives extract values from the MDC that the agent populates automatically.
Now, let’s restart the application and observe the logs:
17:19:43.715 [task-1] [trace_id=da673f1ec49eba77264c5912584e7183 span_id=74c708e335a974e3] INFO  c.e.o.service.OrderSummaryJob - Starting order summary job...
17:19:43.856 [task-1] [trace_id=da673f1ec49eba77264c5912584e7183 span_id=74c708e335a974e3] INFO  c.e.o.service.OrderSummaryJob - Found 12 orders to process
17:19:43.857 [task-1] [trace_id=da673f1ec49eba77264c5912584e7183 span_id=74c708e335a974e3] INFO  c.e.o.service.OrderSummaryJob - Processing order 1 for customer CUST-10001...
17:19:45.860 [task-1] [trace_id=da673f1ec49eba77264c5912584e7183 span_id=74c708e335a974e3] INFO  c.e.o.service.OrderSummaryJob - Processing order 3 for customer CUST-10003...

...

17:19:53.704 [task-3] [trace_id=4a969bbb00634e0ee36b2fbda1399d8a span_id=0a602f1a58df2f71] INFO  c.e.o.service.OrderSummaryJob - Starting order summary job...
17:19:53.715 [task-3] [trace_id=4a969bbb00634e0ee36b2fbda1399d8a span_id=0a602f1a58df2f71] INFO  c.e.o.service.OrderSummaryJob - Found 12 orders to process
17:19:53.715 [task-3] [trace_id=4a969bbb00634e0ee36b2fbda1399d8a span_id=0a602f1a58df2f71] INFO  c.e.o.service.OrderSummaryJob - Processing order 1 for customer CUST-10001...
17:19:53.868 [task-1] [trace_id=da673f1ec49eba77264c5912584e7183 span_id=74c708e335a974e3] ERROR c.e.o.service.OrderSummaryJob - Failed to process order 9: Order amount exceeds threshold: 458.23
All logs from the first execution share the same trace_id (da673f1ec49eba77264c5912584e7183), while logs from the third execution have a different trace_id (4a969bbb00634e0ee36b2fbda1399d8a). Even though both executions are running concurrently and their logs are interleaved, you can now filter by trace ID to isolate a single execution.
For example, to see logs only from the first execution, you could search for trace_id=da673f1ec49eba77264c5912584e7183 in a log aggregation tool such as Amazon CloudWatch.
All the code used in this tutorial is available on GitHub.
Future Considerations
To make filtering even more powerful, you can update this logging strategy further by adding structured fields to logs for record IDs or job phases. For example, you could log order_id as a dedicated field alongside the trace ID, allowing you to query all executions that touched a specific order.
You can also export logs alongside traces to an observability backend like Jaeger or Grafana. This allows you to visualize the full trace as a timeline, showing how long each step took and where errors occurred. The OpenTelemetry agent supports exporting to multiple backends by changing the exporter configuration, so you can start with logging and migrate to a full observability platform later without making any changes to your instrumentation code.
You can also apply this same pattern to other background jobs, API handlers, or any asynchronous work in your system. Once OpenTelemetry is in place, every part of your application automatically benefits from trace context propagation, making it easier to debug complex workflows that span multiple services or components.
Conclusion
In this guide, you built a Kotlin and Spring Boot application with a scheduled background job, observed how plain logging breaks down under concurrency, and solved the problem by instrumenting the application with OpenTelemetry. You learned how the OpenTelemetry Java Agent automatically injects trace context into logs without requiring code changes, and how trace IDs enable you to correlate logs from a single execution even when multiple executions run concurrently.
Observability isn’t just about adding more logs; it’s about adding structure and context to the signals your system already emits. With OpenTelemetry, you can turn interleaved, confusing logs into isolated, queryable execution traces.
But the benefits go beyond debugging. Building systems with observability in mind changes how you design them. Traces reveal where boundaries should exist and help you set realistic timeouts based on actual production data. Metrics show trends over time, which make it easier to plan capacity, define SLOs, and alert on deviations before your users are affected. Additionally, well-instrumented code is more readable. When every operation is traced, you think more carefully about what constitutes a meaningful unit of work, which makes the system clearer for both observability tools and other developers.