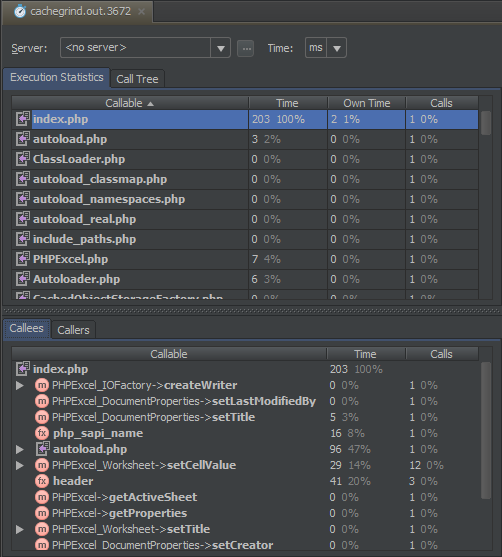
Profiling PHP applications with PhpStorm
That application we are building is way too slow. What gives? Did someone on our team commit code while partying? Are we making too many database calls? The only way to learn about the performance of our application code is to profile it. Something that’s fairly easy to do with PhpStorm!
Whether it’s a full web application, some library code or just a unit test, profiling allows us to gather program execution statistics. Information like the names of functions executed, the number of times a function has been executed, how long a function took to execute and such can give us a hint on where our code can be improved.
PhpStorm comes with support for two popular PHP profilers: Xdebug and Zend Debugger. Curious to see how this works? Head over the tutorial of your choice:
- Profiling PHP applications with PhpStorm and Xdebug
- Profiling PHP applications with PhpStorm and Zend Debugger
Give it a try and share your feedback through the issue tracker, the comments below or in our forums!
Develop with pleasure!
– JetBrains PhpStorm Team
Subscribe to PhpStorm Blog updates


