JetBrains Platform
Plugin and extension development for JetBrains products.
Investigating IntelliJ Platform UI Freezes

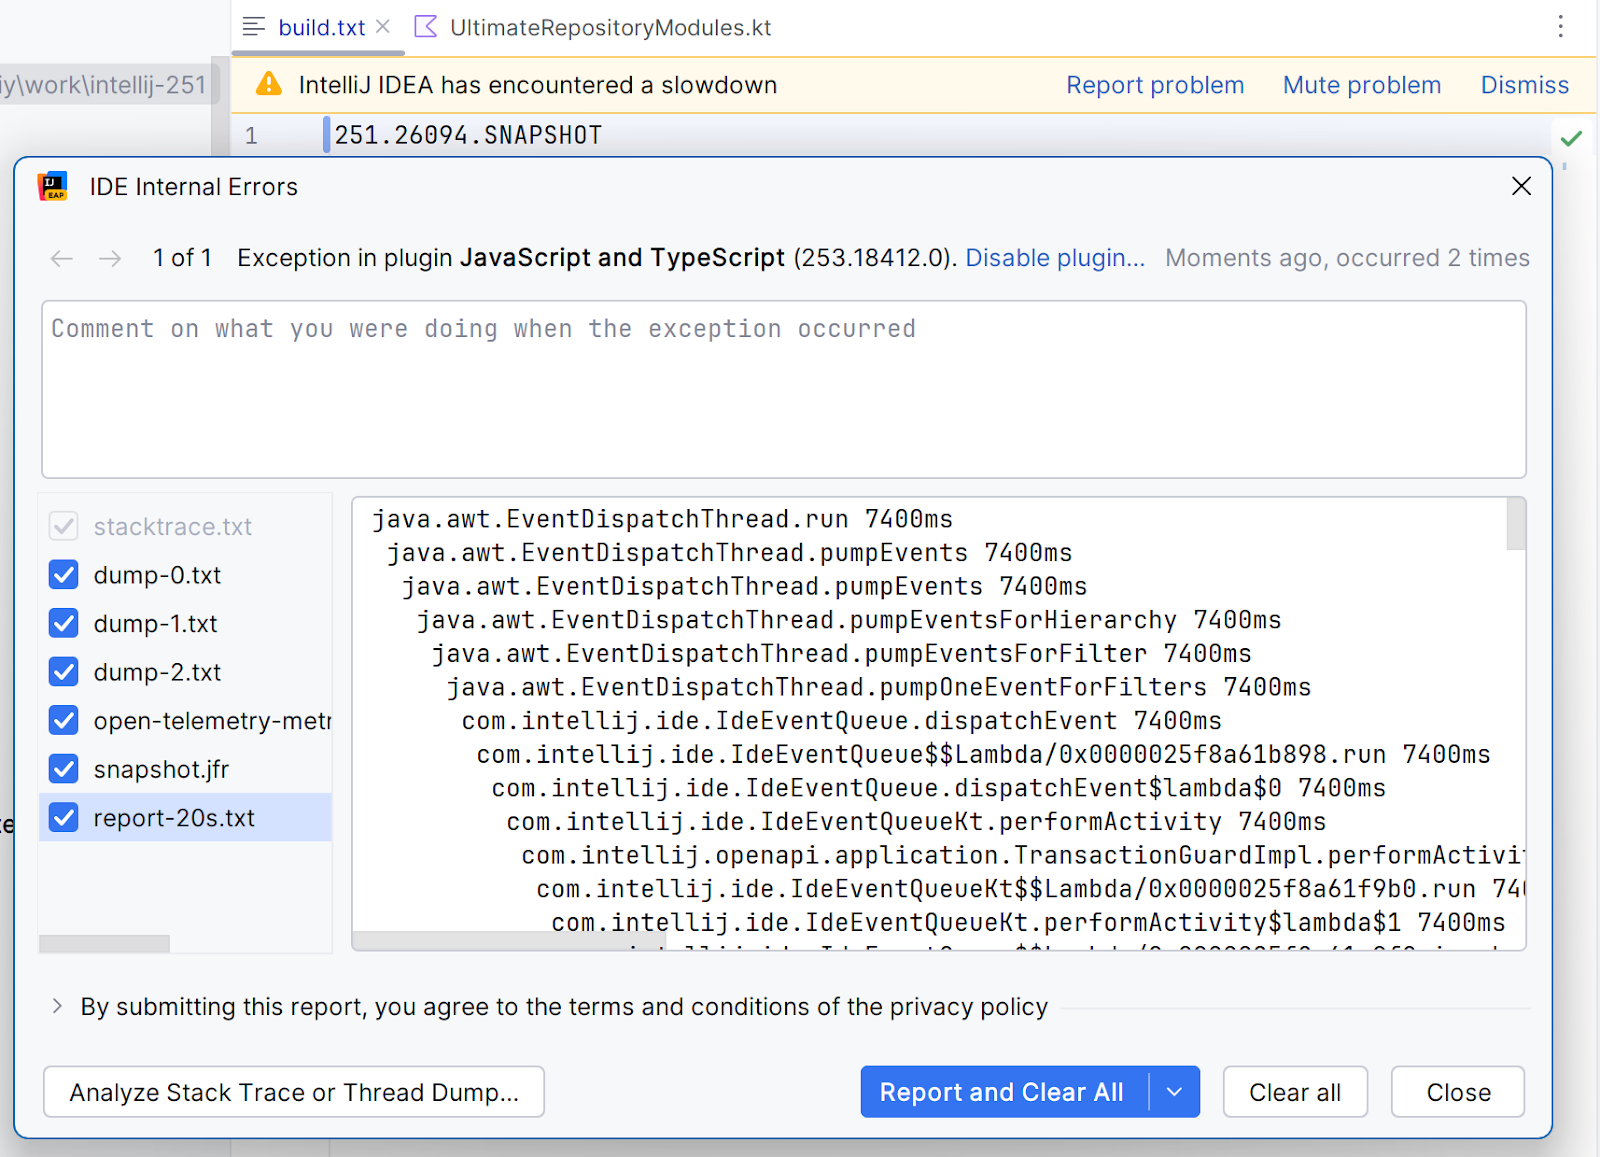
You have probably seen this picture occasionally and wondered what is happening with your IDE and why it freezes! This is a tricky question, and many types of bugs and performance issues may lead to UI freezes.
JetBrains IDEs are built on top of a UI framework (the Java AWT) that uses a single thread, the event dispatch thread (EDT), to perform painting operations and process user input events.
A UI freeze occurs when the IDE cannot execute operations on the EDT, preventing interaction with the IDE. This blog tries to consolidate our knowledge about freezing reasons and causes. Use it to investigate and resolve UI freezes in your IDE plugins!
The IntelliJ Platform’s UI architecture
Because our UI frameworks are built on top of a single thread, it is important to keep the EDT from remaining blocked for a long time. The EDT runs an event loop that processes AWT events. Typical examples of these events are user input (such as typing or moving the mouse) and repaint requests from Swing.
Events need to be processed within 16 ms. Otherwise, the IDE is not able to render 60 frames per second.
Investigating UI freezes
In the vast majority of cases, simply looking at the thread dump will give you the information you need about a UI freeze. The investigation should start with the thread AWT-EventQueue-N – this is the EDT. Normally, its name should be AWT-EventQueue-0. If you see a bigger number in the suffix, there might be a platform issue.
In the event of a UI freeze, the EDT is usually blocked on some kind of lock.
Freezes caused by the read-write lock
If you are unfamiliar with the concept of the IntelliJ Platform’s read-write lock, you can learn more about it from this notebook.
Due to the IntelliJ Platform’s architecture, the write lock is often acquired on the EDT. Since it often isn’t possible to acquire the write lock immediately, you will sometimes see the following lines in the stack trace of the EDT:
"AWT-EventQueue-0" prio=0 tid=0x0 nid=0x0 waiting on condition
     java.lang.Thread.State: TIMED_WAITING
 on com.intellij.openapi.progress.util.EternalEventStealer@3a946cba
at java.base@21.0.8/java.lang.Object.wait0(Native Method)
...
(!) at com.intellij.platform.locking.impl.NestedLocksThreadingSupport$ComputationState.upgradeWritePermit(NestedLocksThreadingSupport.kt:370)
...
at com.intellij.platform.locking.impl.NestedLocksThreadingSupport.runWriteAction(NestedLocksThreadingSupport.kt:921)
...
at com.intellij.ide.IdeEventQueue.dispatchEvent(IdeEventQueue.kt:347)
...
at java.desktop/java.awt.EventDispatchThread.run(EventDispatchThread.java:92)
The key line here is marked with (!). This line indicates that the EDT is blocked on the acquisition of the write lock. In this case, there is no need to look above. The IntelliJ Platform usually enters emergency mode if it detects a UI freeze and runs some of its internal procedures.
The EDT being blocked on the write lock is a sign that a thread is running under the read lock. The next step in our investigation is to find this background thread. This can be done by searching for a substring readAction (case-insensitive) in the thread dump.
For example, we may find the following thread:
"JobScheduler FJ pool 1/11" prio=0 tid=0x0 nid=0x0 runnable
     java.lang.Thread.State: RUNNABLE

	at ai.grazie.rules.en.QuantifierNounCompatibility.<clinit>(QuantifierNounCompatibility.java:38)
	at ai.grazie.rules.en.AgreementSet.<clinit>(AgreementSet.java:42)
	at ai.grazie.rules.en.PluralsInCompounds.<clinit>(PluralsInCompounds.java:21)
	at ai.grazie.rules.en.Articles.<clinit>(Articles.java:250)
	...
	at ai.grazie.rules.toolkit.LanguageToolkit.allParameters(LanguageToolkit.java:87)
	(!!) at com.intellij.grazie.pro.TreeRuleChecker.calcParameters(TreeRuleChecker.java:234)
	...
	at com.intellij.codeInsight.daemon.impl.AnnotatorRunner$$Lambda/0x00000070047e8000.run(Unknown Source)
	...
	(!) at com.intellij.platform.locking.impl.NestedLocksThreadingSupport.tryRunReadAction(NestedLocksThreadingSupport.kt:826)
	...
	at java.base@21.0.8/java.util.concurrent.ForkJoinWorkerThread.run(ForkJoinWorkerThread.java:187)
This thread is taken from ForkJoinPool, and we see that it is currently running a read action (at (!)). We also see AnnotatorRunner in the stack trace, which means that this thread is currently running highlighting. The read actions in highlighting are canceled on a pending write action, which means that the UI freeze is caused by the code not checking for ProgressManager.checkCanceled. In the middle of the block, we see some traces from the Grazie plugin (starting from (!!)). This concludes our investigation. We’ve found the problem – Grazie does not check for checkCanceled frequently enough, which causes the UI to freeze.
Freezes caused by a background write action
The IntelliJ Platform gradually moves write actions to background threads, but this functionality is currently unstable, and it can cause additional UI freezes and deadlocks.
While a write action can run in the background, the EDT still often acquires a write-intent lock, resulting in stack traces like the following:
"AWT-EventQueue-0" #91 [119043] prio=6 os_prio=31 cpu=71985.87ms elapsed=1065.05s tid=0x00000001610c4c00 nid=119043 sleeping [0x0000000398429000]
   java.lang.Thread.State: TIMED_WAITING (sleeping)
	at java.lang.Thread.sleep0(java.base@21.0.8/Native Method)
	...
	at com.intellij.platform.locking.impl.NestedLocksThreadingSupport$ComputationState.acquireWriteIntentPermit(NestedLocksThreadingSupport.kt:416)
	...
	at java.awt.EventDispatchThread.run(java.desktop/EventDispatchThread.java:92)
This means that the EDT cannot immediately acquire a write-intent lock. Our next step is to search for a write action. In this case, it may appear in coroutine dumps. For example:
- "RefreshQueue pool":StandaloneCoroutine{Active}, state: SUSPENDED [Kernel@lumrbnr1s12qelije7p5, Rete(abortOnError=false, commands=capacity=2147483647,data=[onReceive], reteState=kotlinx.coroutines.flow.StateFlowImpl@6d763516, dbSource=ReteDbSource(reteState=kotlinx.coroutines.flow.StateFlowImpl@6d763516)), DbSourceContextElement(kernel Kernel@lumrbnr1s12qelije7p5), ComponentManager(ApplicationImpl@106897812), com.intellij.codeWithMe.ClientIdContextElementPrecursor, Dispatchers.Default.limitedParallelism(1)]
	at com.intellij.core.rwmutex.WriteIntentPermitImpl.acquireWriteActionPermit(RWMutexIdea.kt:263)
	...
	at com.intellij.openapi.vfs.newvfs.RefreshQueueImpl.processEventsSuspending(RefreshQueueImpl.kt:191)
  ...
	at com.intellij.openapi.vfs.newvfs.RefreshQueueImpl$queueAsyncSessionWithCoroutines$3$1.invokeSuspend(RefreshQueueImpl.kt:177)
Here we see that a coroutine is SUSPENDED on acquisition of the write lock. In particular, VFS refresh cannot proceed, which means that a read action is alive. Indeed:
"JobScheduler FJ pool 7/9" #201 [175107] daemon prio=6 os_prio=31 cpu=153605.15ms elapsed=1039.57s tid=0x0000000142955a00 nid=175107 runnable  [0x00000003610e7000]
   java.lang.Thread.State: RUNNABLE
	at com.intellij.psi.impl.file.impl.MultiverseFileViewProviderCache.get(MultiverseFileViewProviderCache.kt:67)
	...
	at org.jetbrains.kotlin.idea.codeInsight.lineMarkers.KotlinRecursiveCallLineMarkerProvider.collectSlowLineMarkers(KotlinRecursiveCallLineMarkerProvider.kt:35)
	...
	at com.intellij.openapi.application.impl.ApplicationImpl.tryRunReadAction(ApplicationImpl.java:1206)
	...
	at java.util.concurrent.ForkJoinWorkerThread.run(java.base@21.0.8/ForkJoinWorkerThread.java:187)
Here we again arrive at the conclusion that some code cannot be canceled due to the read action. The process of resolving this freeze is similar to what we have discussed above.
SuvorovProgress
Sometimes the EDT is blocked in a class named SuvorovProgress:
"AWT-EventQueue-0" prio=0 tid=0x0 nid=0x0 waiting on condition
     java.lang.Thread.State: TIMED_WAITING
 on com.intellij.openapi.progress.util.EternalEventStealer@215bb938
	at java.base@21.0.7/java.lang.Object.wait0(Native Method)
	at java.base@21.0.7/java.lang.Object.wait(Object.java:366)
	at com.intellij.openapi.progress.util.EternalEventStealer.dispatchAllEventsForTimeout(SuvorovProgress.kt:261)
	at com.intellij.openapi.progress.util.SuvorovProgress.processInvocationEventsWithoutDialog(SuvorovProgress.kt:125)
	at com.intellij.openapi.progress.util.SuvorovProgress.dispatchEventsUntilComputationCompletes(SuvorovProgress.kt:73)
	at com.intellij.openapi.application.impl.ApplicationImpl.lambda$postInit$14(ApplicationImpl.java:1434)
	at com.intellij.openapi.application.impl.ApplicationImpl$$Lambda/0x000076ace059cff8.invoke(Unknown Source)
	at com.intellij.platform.locking.impl.RunSuspend.await(NestedLocksThreadingSupport.kt:1517)
	at com.intellij.platform.locking.impl.NestedLocksThreadingSupportKt.runSuspendWithWaitingConsumer(NestedLocksThreadingSupport.kt:1472)
	...
	at com.intellij.platform.locking.impl.NestedLocksThreadingSupport.runWriteAction(NestedLocksThreadingSupport.kt:921)
	...
	at java.desktop/java.awt.EventDispatchThread.pumpEvents(EventDispatchThread.java:105)
	at java.desktop/java.awt.EventDispatchThread.run(EventDispatchThread.java:92)
SuvorovProgress is merely a symptom of a UI freeze, however. It indicates that the IntelliJ Platform is in emergency mode, where it is still able to run certain trusted AWT events or draw a freeze popup UI.
It is very rarely a cause of a freeze, so the problem is likely somewhere else.
Freezes caused by thread starvation
The IntelliJ Platform uses the Kotlin Coroutines library a lot. In coroutines, there are two major thread pools: Dispatchers.Default and Dispatchers.IO. Both are bounded, with Dispatchers.Default containing as many threads as there are cores in your machine and Dispatchers.IO containing 64 threads. If all these threads are blocked on some operation, then the IDE encounters thread starvation – a situation where coroutine machinery cannot progress because all threads in a thread pool are blocked.
The usual symptom of thread starvation is coroutines being stuck in the Cancelling state. They cannot move into Cancelled because they cannot execute cleanup actions on their respective thread pools.
To investigate thread starvation of the Default dispatcher, you need to find all blocked threads that contain runDefaultDispatcherTask.
For example:
"DefaultDispatcher-worker-9@28483" daemon prio=5 tid=0xa0 nid=NA waiting
  java.lang.Thread.State: WAITING
	at jdk.internal.misc.Unsafe.park(Unsafe.java:-1)
	at java.util.concurrent.locks.LockSupport.parkNanos(LockSupport.java:269)
	...

	at kotlinx.coroutines.BuildersKt__BuildersKt.runBlocking$default(Builders.kt:48)
	at kotlinx.coroutines.BuildersKt.runBlocking$default(Unknown Source:1)
	(!!) at com.intellij.platform.pluginManager.frontend.BackendUiPluginManagerController.awaitForResult(BackendUiPluginManagerController.kt:293)
	...
	at kotlinx.coroutines.scheduling.CoroutineScheduler.runSafely(CoroutineScheduler.kt:610)
	(!) at kotlinx.coroutines.scheduling.CoroutineScheduler$Worker.runDefaultDispatcherTask(CoroutineScheduler.kt:882)
	at kotlinx.coroutines.scheduling.CoroutineScheduler$Worker.executeTask(CoroutineScheduler.kt:906)
	at kotlinx.coroutines.scheduling.CoroutineScheduler$Worker.runWorker(CoroutineScheduler.kt:775)
	at kotlinx.coroutines.scheduling.CoroutineScheduler$Worker.run(CoroutineScheduler.kt:762)
If there are as many such threads as cores in your machine (at (!)), then you have signs of thread starvation. Similarly, if you’re dealing with thread starvation of the IO dispatcher, you’ll have 64 blocked threads named DefaultDispatcher-worker-N.
NB: It is not enough to look at all threads that are named DefaultDispatcher-worker-N to conclude that there is thread starvation of the Default dispatcher. The coroutine scheduler shares physical threads between the Default and IO dispatchers, so it is difficult to say which thread belongs to which dispatcher without actually looking at the source code.
To fix thread starvation, blocking operations need to be moved out of the Default dispatcher. Here we see that runBlocking is used in the line with (!!), and it needs to be moved to a different dispatcher.
Freezes caused by service initialization
Another frequent source of locks in the IntelliJ Platform is service initialization. Since services are initialized once, a thread that tries to access a service can block while waiting for initialization on another thread.
Here’s an example of this scenario:
"AWT-EventQueue-0" #59 [128003] prio=6 os_prio=31 cpu=3011.23ms elapsed=172.40s tid=0x000000012c07ae00 nid=128003 waiting on condition  [0x000000039b0ae000]
   java.lang.Thread.State: TIMED_WAITING (parking)
	at jdk.internal.misc.Unsafe.park(java.base@21.0.7/Native Method)
	...
	(!) at com.intellij.serviceContainer.ComponentManagerImplKt.runBlockingInitialization$lambda$9(ComponentManagerImpl.kt:1660)
	...
	at com.intellij.serviceContainer.ComponentManagerImpl.getService(ComponentManagerImpl.kt:672)
	(!!) at com.intellij.xdebugger.XDebuggerManager.getInstance(XDebuggerManager.java:32)
	...
	(!!!) at com.intellij.platform.locking.impl.NestedLocksThreadingSupport.runWriteAction(NestedLocksThreadingSupport.kt:939)
	...
	at java.awt.EventDispatchThread.run(java.desktop/EventDispatchThread.java:92)
We see that the EDT is blocked on the initialization of a service in the line marked (!). The service is XDebuggerManager (at (!!)), so there might be something wrong inside it. Additionally, we note that this process is running under the write action (at (!!!)), an observation that will be useful later.
By searching for XDebuggerManager, we can find the following thread:
"DefaultDispatcher-worker-4" #55 [130051] daemon prio=5 os_prio=31 cpu=1537.10ms elapsed=172.41s tid=0x000000012b883c00 nid=130051 in Object.wait()  [0x000000036b607000]
   java.lang.Thread.State: WAITING (on object monitor)
	at java.lang.Object.wait0(java.base@21.0.7/Native Method)
	...
	(!) at com.intellij.openapi.application.impl.ApplicationImpl.runReadAction(ApplicationImpl.java:1028)
	at com.intellij.xdebugger.impl.breakpoints.XBreakpointManagerImpl.loadState(XBreakpointManagerImpl.java:536)
	at com.intellij.xdebugger.impl.XDebuggerManagerImpl.loadState(XDebuggerManagerImpl.java:388)
	(!!) at com.intellij.xdebugger.impl.XDebuggerManagerImpl.loadState(XDebuggerManagerImpl.java:81)
	...
	at com.intellij.configurationStore.ComponentStoreWithExtraComponents.initComponentBlocking(ComponentStoreWithExtraComponents.kt:43)
	...
	at kotlinx.coroutines.scheduling.CoroutineScheduler$Worker.run(CoroutineScheduler.kt:765)
The service instance initialization at (!!) tries to acquire the read lock (at (!)). The problem is clear – the write action on the EDT is blocked on the lock in service init, and service init is blocked on the read lock acquisition. This is a deadlock because of the incorrect order of the two locks.
The best way to fix it is to move the read action out of service initialization. If this is not possible, you can preload the service in the read action. This way, service initialization will inherit read access.
How to deal with runBlocking
Sometimes, you may notice that a thread is blocked in runBlocking. This means that it is trying to execute coroutines synchronously.
For example:
"JobScheduler FJ pool 6/15" prio=0 tid=0x0 nid=0x0 waiting on condition
     java.lang.Thread.State: TIMED_WAITING
 on kotlinx.coroutines.BlockingCoroutine@41813fd4
	at java.base@21.0.8/jdk.internal.misc.Unsafe.park(Native Method)
	...
	at kotlinx.coroutines.BuildersKt__BuildersKt.runBlocking$BuildersKt__BuildersKt(Builders.kt:85)
	...
	(!) at com.intellij.openapi.progress.CoroutinesKt.runBlockingCancellable(coroutines.kt:117)
	at com.intellij.grazie.text.CheckerRunner.run(CheckerRunner.kt:53)
	...
	(!!) at com.intellij.openapi.application.impl.ApplicationImpl.tryRunReadAction(ApplicationImpl.java:1206)
	...
	at java.base@21.0.8/java.util.concurrent.ForkJoinWorkerThread.run(ForkJoinWorkerThread.java:187)
First, we need to make sure that runBlockingCancellable is present (at (!)). This is a special platform version of runBlocking that works well with our cancellation machinery.
Since this thread runs the read action (at (!!)), we now need to figure out why it cannot be canceled. To do this, we need to look in the coroutine dump and search for the coroutine tree starting with BlockingCoroutine (this is the name of the coroutine corresponding to runBlocking). Here’s what we find:
- JobImpl{Active}
	- BlockingCoroutine{Active}@41813fd4, state: SUSPENDED [ModalityState.NON_MODAL, ComputationState(level=0,thisLevelLock=com.intellij.core.rwmutex.RWMutexIdeaImpl@1c825ccf,isParallelizedRead=true), BlockingEventLoop]
		at com.intellij.grazie.text.CheckerRunner$run$1.invokeSuspend(CheckerRunner.kt:69)
		- DeferredCoroutine{Active}, state: SUSPENDED [ModalityState.NON_MODAL, ComputationState(level=0,thisLevelLock=com.intellij.core.rwmutex.RWMutexIdeaImpl@1c825ccf,isParallelizedRead=true), BlockingEventLoop]
			at com.intellij.ml.grazie.pro.SentenceBatcher$forSentences$1.parseAsync(SentenceBatcher.kt:96)
			at com.intellij.ml.grazie.pro.CloudOrLocalBatchParser.parseAsync(CloudOrLocalBatchParser.kt:20)
			at com.intellij.ml.grazie.pro.ParsedSentence$Companion.getSentences(ParsedSentence.kt:104)
			at com.intellij.ml.grazie.pro.AsyncTreeRuleChecker.checkExternally$suspendImpl(AsyncTreeRuleChecker.kt:18)
			at com.intellij.ml.grazie.pro.AsyncTreeRuleChecker$Style.checkExternally(AsyncTreeRuleChecker.kt:48)
			at com.intellij.grazie.text.CheckerRunner$run$1$deferred$1$1.invokeSuspend(CheckerRunner.kt:56)
We see that this coroutine runs at com.intellij.grazie.text.CheckerRunner, which means that this BlockingCoroutine corresponds to runBlocking in the above trace. Now we can inspect the coroutine tree and try to find out the cause of the freeze.
Since the state of the coroutine is DeferredCoroutine{Active}, it is not canceled. This means something is wrong with cancellation in the platform, as the platform should cancel all read actions on an incoming write action; hence, all coroutines should also be canceled. Normally, we should see BlockingCoroutine{Cancelling} here.
To fix this UI freeze, we need to figure out why the coroutine cannot transition to the {Cancelled} state. Most likely, the code does not call ProgressManager.checkCanceled() frequently enough.
Conclusion
In this blog post, we explored common sources of UI freezes in IDEs based on the IntelliJ Platform. Most often, the freezes are caused by insufficient cooperation between plugin code and the IntelliJ Platform. By using the IntelliJ Platform’s primitives for executing cancellable operations, we can greatly improve the responsiveness of JetBrains IDEs.