JetBrains Platform
Plugin and extension development for JetBrains products.
Extending Qodana: Adding Custom Code Inspections
Qodana is a static code analysis tool that brings code inspections and quick-fixes from JetBrains IDEs to the realm of continuous integration. It can be run in the cloud, executed from a Docker container, integrated into CI/CD pipelines, or invoked through a JetBrains IDE.
Qodana already offers an impressive suite of inspections, but it is not limited to what comes built in. You can add custom inspections to enforce project specifics and conventions.
For example, imagine a project with a specific code convention:
Each Kotlin class in a
servicepackage must have aServicesuffix.
In this case, com.jetbrains.service.JetComponent would not conform to this convention, while com.jetbrains.service.BrainComponentService would be perfectly fine. In what follows, we’ll build a plugin that implements this inspection, allowing Qodana to enforce this convention in future projects.
We can implement this code convention by creating a custom code inspection packaged in a plugin. Qodana plugins are developed just like JetBrains IDE plugins, which is to say we simply need to create an IntelliJ Platform plugin that can be run in Qodana. Here’s a quick overview of the steps we’ll take:
- Initialize the project from the IntelliJ Platform Plugin Template.
- Adjust the project properties and plugin descriptor along with necessary dependencies.
- Declare the local inspection in the plugin descriptor and implement it in Kotlin.
- Build and package the plugin.
- In the example playground project, put the plugin artifact into a proper directory.
- Adjust the Qodana configuration file.
- Run Qodana and look at the report!
Preparing the plugin project
To bootstrap the project, visit the IntelliJ Platform Plugin Template repository and click the Use this template button to create a plugin repository. Name it classname-inspection-qodana-plugin, copy the project URL, and open it in IntelliJ IDEA. When the project is ready, customize gradle.properties by declaring the pluginGroup, pluginName, and pluginRepositoryUrl as necessary. Remember to click the Sync Gradle Changes floating button to apply the changes. To modify the unique plugin identifier, change the id element in the plugin descriptor plugin.xml.
Declaring dependencies
Our code inspection targets Kotlin classes, so we need to add the Kotlin plugin to the Qodana plugin’s dependencies. The gradle.properties file requires you to declare:
platformBundledPlugins = org.jetbrains.kotlin
In addition, the plugin descriptor plugin.xml must contain the same bundled Kotlin plugin in its dependencies:
<depends>org.jetbrains.kotlin</depends>
Again, remember to sync Gradle changes by clicking the floating button.
In addition, the Kotlin class inspection needs to support the Kotlin K2 Compiler, which has been enabled by default since version 2025.1 of the IntelliJ Platform. In the plugin descriptor, declare the org.jetbrains.kotlin.supportsKotlinPluginMode extension.
<extensions defaultExtensionNs="org.jetbrains.kotlin">
    <supportsKotlinPluginMode supportsK2="true" />
</extensions>
Creating the code inspection
The actual code for any code inspection that targets Kotlin classes requires three steps:
- Declare a
com.intellij.localInspectionextension in the plugin descriptor along with the necessary attributes and a fully qualified reference to the implementation class. - Create an implementation class, preferably in Kotlin.
- Provide a standalone HTML file with an inspection description, usage guidelines, and an example.
Declaring the extension
Add the following declaration to the plugin.xml plugin descriptor file:
<extensions defaultExtensionNs="com.intellij">
    <localInspection
        language="kotlin"
        implementationClass="org.intellij.sdk.codeInspection.ServicePackageClassNameInspection"
        enabledByDefault="true"
        displayName="SDK: Discouraged class name"
        groupName="Kotlin"
    />
</extensions>
The language attribute indicates that the inspection applies to Kotlin source code files. It is important to explicitly enable the inspection by default; otherwise, Qodana will not run it. Then provide a human-readable descriptive displayName to be shown in the report and settings. The groupName attribute sets the inspection category that is shown both in the Qodana report and in the IDE settings. Finally, provide a fully qualified name for the implementation class.
Code inspection source code
The Kotlin plugin provides a useful base inspection class for Kotlin inspections: AbstractKotlinInspection. Override the buildVisitor method and provide a PSI visitor instance that traverses the Kotlin class elements in a type-safe way. classVisitor is a convenient DSL-like function that returns this kind of PSI visitor and is invoked on any Kotlin class in the project you’re inspecting.
package org.intellij.sdk.codeInspection

import com.intellij.codeInspection.ProblemHighlightType
import com.intellij.codeInspection.ProblemsHolder
import com.intellij.psi.PsiElementVisitor
import org.jetbrains.kotlin.idea.codeinsight.api.classic.inspections.AbstractKotlinInspection
import org.jetbrains.kotlin.psi.KtClass
import org.jetbrains.kotlin.psi.KtVisitorVoid
import org.jetbrains.kotlin.psi.classVisitor

class ServicePackageClassNameInspection : AbstractKotlinInspection() {
    override fun buildVisitor(holder: ProblemsHolder, isOnTheFly: Boolean) = classVisitor { klass ->
        val classNamePsi = klass.nameIdentifier ?: return@classVisitor
        val classFqn = klass.fqName?.asString() ?: return@classVisitor
        if (klass.packageLastComponent == "service" && !classFqn.endsWith("Service")) {
            holder.registerProblem(
                classNamePsi,
                "Class name in the 'service' package must have a 'Service' suffix"
            )
        }
    }

    private val KtClass.packageLastComponent: String
        get() = containingKtFile.packageFqName.shortName().asString()
}
The visitor subclass extracts the fully qualified Kotlin class name, inspects the rightmost package element, and checks the corresponding suffix. Any improper class name is reported to the ProblemsHolder instance with an enclosing class as a PSI element and a human-readable problem description.
Inspection description
Each local inspection requires a companion description file, represented as HTML. If you use the Create description file ServicePackageClassNameInspection.html quick-fix, a file named src/main/resources/inspectionDescriptions/ServicePackageClassName.html will be created in the proper location. You’ll also have to provide a description that will be shown in the Qodana report and in the IDE settings.
<html>
<body>
Reports class names in the <code>service</code> packages that lack the <code>Service</code> suffix.
<p><b>Example:</b></p>
<pre><code>
  package com.example.foo.service
  class SomeComponent {
    /* class members */
  }
</code></pre>
</body>
</html>
Build the plugin
You’re all set – time to build! Execute the buildPlugin Gradle task and look at the build/distributions/qodana-code-inspection-0.0.1.zip artifact available in the Gradle output directory. The JAR file will be used as the primary artifact in the Qodana scan.
Keep the plugin artifact type in mind
Qodana does not directly support local ZIP plugin artifacts that include additional JAR archives or third-party dependencies. Any plugin needs to be packaged as a single JAR or unzipped into a specific directory.
Run Qodana on a playground project
Let’s create a playground project, written in Kotlin, that we can inspect with Qodana now that we’ve extended it with our plugin. To run the Qodana plugin locally, make sure that two software components are available on your system:
Our playground project should contain a class called src/main/kotlin/org/intellij/sdk/qodana/service/SomeComponent.kt, which does not follow our code convention, as it does not have the Service suffix. There are two ways to integrate the Qodana plugin into Qodana:
- Publish it on JetBrains Marketplace
- For quicker turnaround, put the plugin’s JAR artifact into your project’s
.qodanadirectory.
To simplify the build, copy the build/distributions/qodana-code-inspection-0.0.1.zip file from the plugin project to the .qodana/qodana-code-inspection-0.0.1.zip file in the playground project. Create the .qodana directory, if it does not yet exist. Then extract the archive with your preferred program or tool. Qodana is able to access the plugin in the build/distributions/qodana-code-inspection directory.
In addition, Qodana needs to be configured to include our custom code inspection. Change the qodana.yaml file in the root directory of the playground project as follows:
version: "1.0"
linter: qodana-jvm-community
include:
  - name: org.intellij.sdk.codeInspection.ServicePackageClassNameInspection
The include block needs to refer to the fully qualified class name of the code inspection available in the plugin. Now execute the following command to run Qodana from the terminal:
qodana scan --volume $PWD/.qodana/qodana-code-inspection:/opt/idea/custom-plugins/qodana-code-inspection
This will download the corresponding Qodana Docker image. A Docker container will be created and run based on the Qodana configuration. To make the custom plugin accessible inside the Qodana run, mount the Qodana plugin directory from the local filesystem to the appropriate directory inside the Qodana Docker container. After a couple of minutes, Qodana will produce a report summary and print it to the standard output.
Qodana - Detailed summary
Analysis results: 1 problem detected
By severity: High - 1
-------------------------------------------------------
Name                           Severity  Problems count
-------------------------------------------------------
SDK: Discouraged class name    High      1
-------------------------------------------------------
Open the full report in your browser:
  Do you want to open the latest report [Y/n]Yes

!  Press Ctrl+C to stop serving the report

\  Showing Qodana report from http://localhost:8080/... (10s)
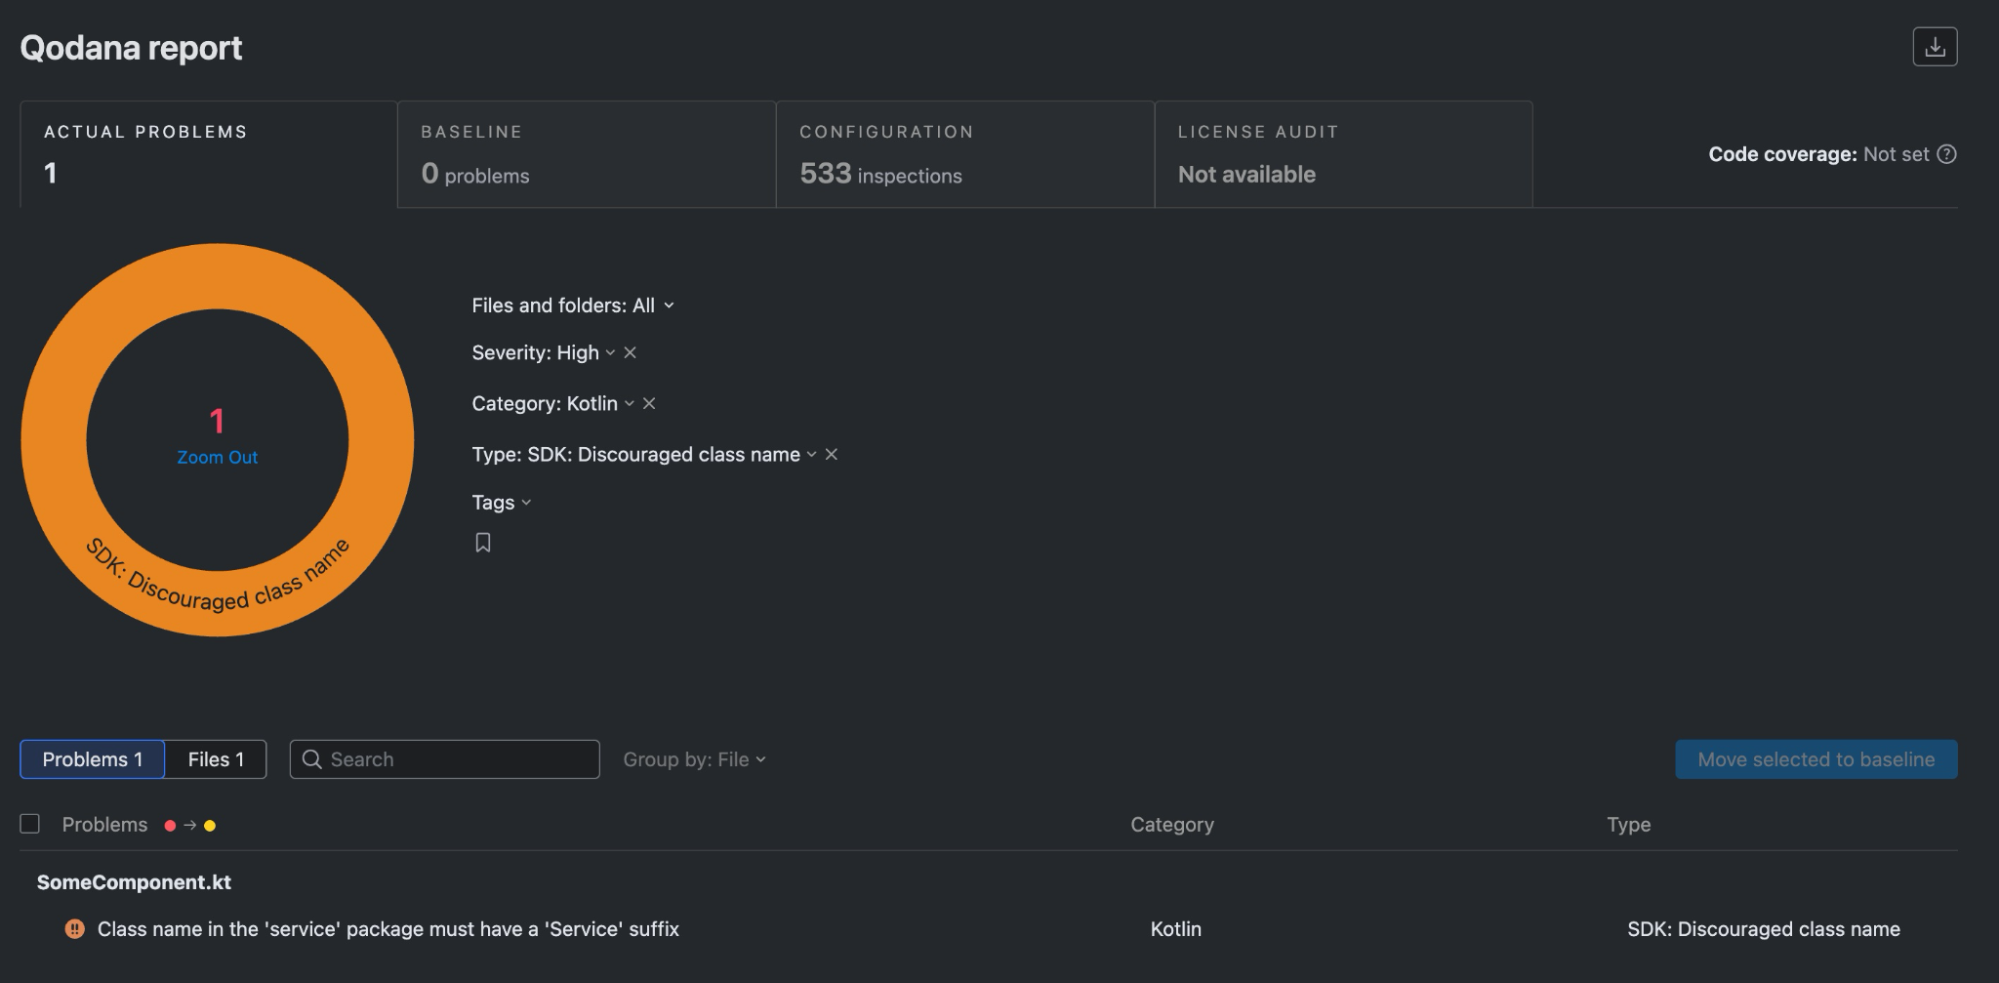
Qodana will show that SomeComponent does not conform to the code convention provided by our local inspection in the Qodana plugin.

Tips for future runs
When the Qodana plugin is modified and rebuilt, the Qodana cache needs to be recreated as well. In such cases, use the --clear-cache CLI switch to reload all of the Qodana run’s dependencies.
qodana scan --clear-cache --volume $PWD/.qodana/qodana-code-inspection-0.0.1.jar:/opt/idea/custom-plugins/codeinspection.jar
Plugging Qodana into your IDE
The Qodana plugin can be installed from disk into the IDE. Its code inspection is then automatically enabled and invoked for any Kotlin class in a project. To check that it’s working, revisit the playground project, open the org.intellij.sdk.qodana.service.SomeComponent class, and make sure that the problematic class name is underlined. As a convenience, hovering the mouse on the class name will show the code inspection result along with the problem description. Alternatively, you can open the Problems tool window and find the problem in the list of all problems reported by code inspections.
The code inspection now behaves like any other inspection provided by the IDE. In Settings | Editor | Inspections | Kotlin, you’ll find the SDK: Discouraged class name inspection, along with the description sourced from the HTML file that we provided before.
Running Qodana within the IDE
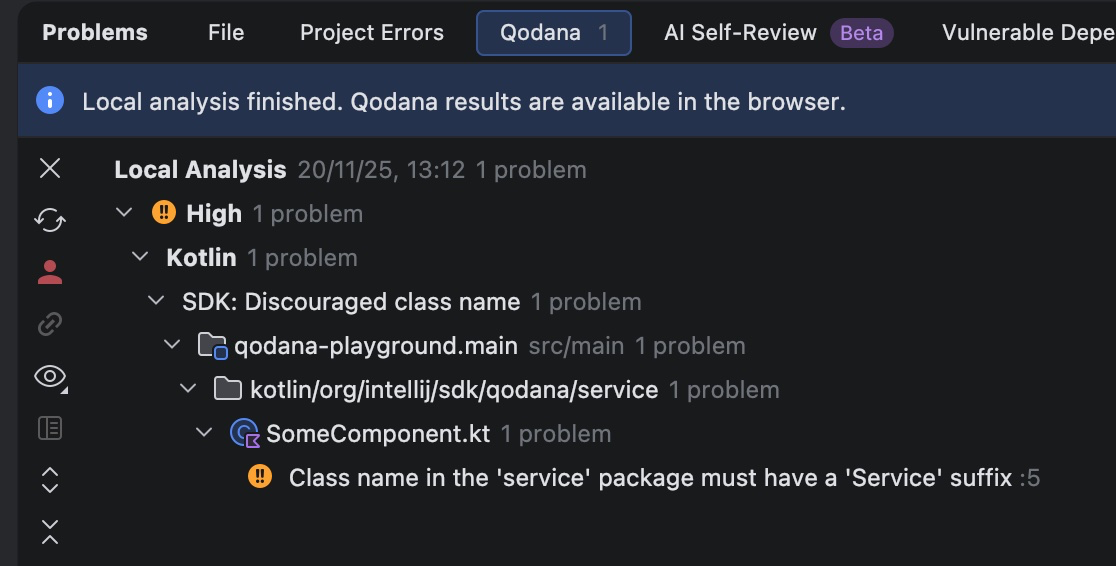
With the plugin installed, you can now run Qodana from your IDE as well. In the Problems tool window, go to the Qodana tab, and click the Try Locally button. Qodana will be configured with the qodana.yaml file and run. The Qodana report can be found directly in the tool window.

Qodana plugins and JetBrains Marketplace
Properly built and tested custom inspection plugins can be published on JetBrains Marketplace, removing the need to serve them from the .qodana directory. Instead, you just need to make sure that the Qodana configuration specifies a public plugin identifier that matches the id element in the plugin descriptor.
version: "1.0"
linter: qodana-jvm-community
plugins:
  - id: com.github.novotnyr.qodanacodeinspection
Qodana’s scan command is simplified, as the .qodana directory mount is no longer necessary.
qodana scan
Qodana downloads this plugin from JetBrains Marketplace and runs all its inspections, producing both console output and an HTML report that can be shown in a web browser.
Summary
We have created a Qodana plugin with a code inspection that checks for a specific code convention, and we have a handful of ways to run it:
- As a JAR placed in the
.qodanadirectory and included in the Qodana YAML file. - As a reference to the publicly available plugin on JetBrains Marketplace.
- As a JAR installed in the IDE, where the inspection is applied in a local Qodana run.
- As a JAR installed in the IDE, where the inspection is included among the integrated code inspections.
See the IntelliJ SDK Code sample for concise examples of both the Qodana plugin and a playground project


