Django Templates Debugging with PyCharm
While more new features are introduced to PyCharm 2.0, the older ones are also being developed — namely Django template debugger, which first appeared in version 1.5.
Now I would like to promote it one more time in order to ask for some feedback for a future development or just inform those who didn’t know about it yet.
How to use the template debugger? Very simple! Just place a breakpoint in your template file at a line with any Django tag or expression.
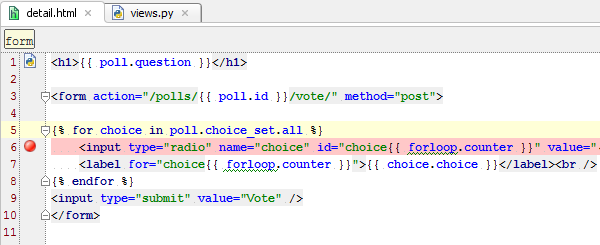
Run Django server in Debug mode (Shift+F9) and make it render the template (e.g. open the page in your browser).
Voilà! The server has been suspended at the breakpoint and you can see all the rendering context in Variables tab.
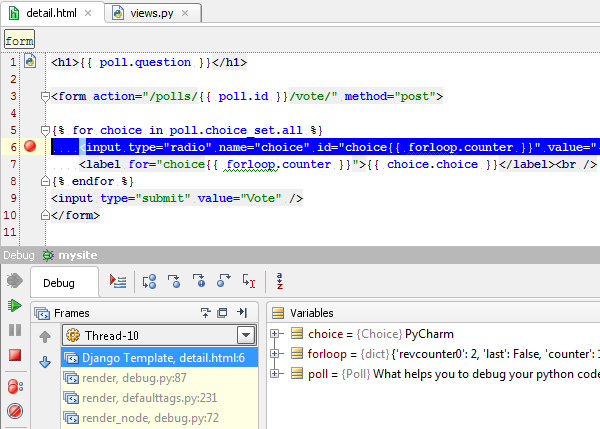
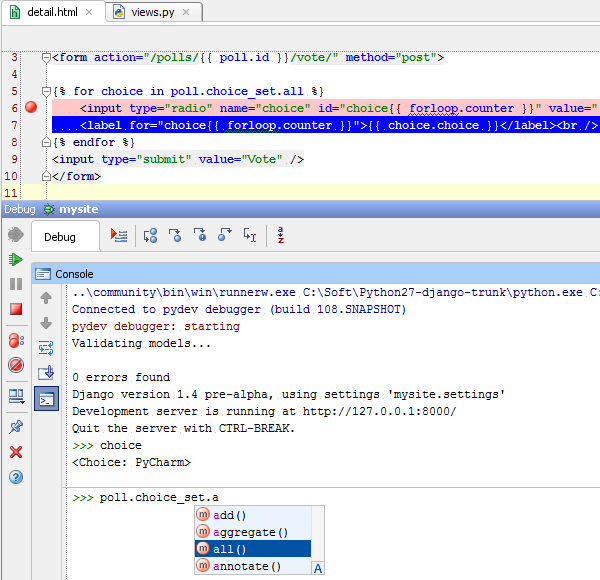
If you’d like to see what’s going on you can step over the expressions and tags one after another, evaluate some expressions (Alt+F8), and of course debug console is enabled and works.
Suffer from exceptions during template rendering? Wanna trace’em out?
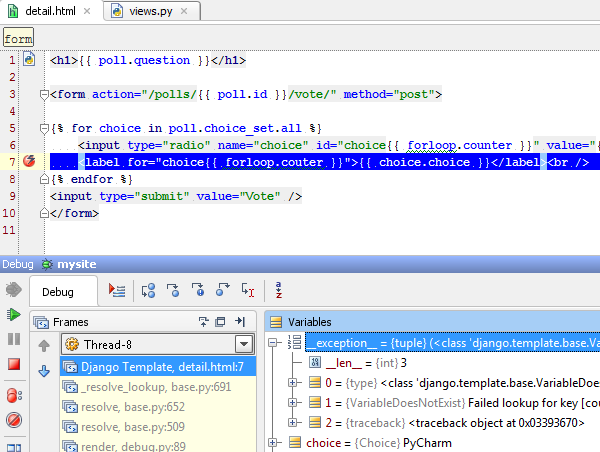
Also simple! Enable Django template exception breakpoints in Breakpoint settings page (Ctrl+Shift+F8) and check the Suspend option.
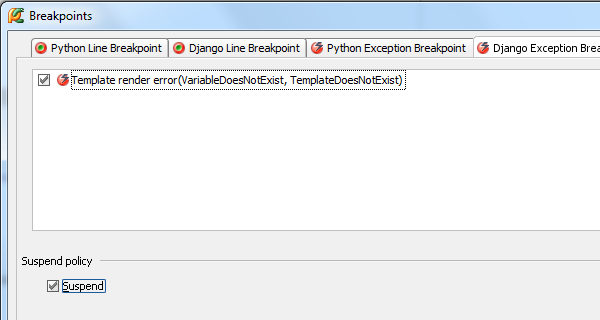
If an exception is raised, the debugger stops at the very line, that has caused it.
And that is still not all.
Also you can set conditions and log messages to breakpoints (like to normal Python breakpoints). In the nearest EAP a new feature is coming: step into a method or filter calls from a template.
And of course all this works for remote debugging as well.
There is a bunch of things in our tracker which are not yet implemented and waiting for their time:
- Evaluate expression using Django syntax
- Support debugging of Django started in autoreload mode
- Support debugging under symlinks
- Break on TemplateSyntaxError
Vote for those you want implemented earlier. Your votes count!
Feel free to let us know your thoughts and ideas or any issues that you have with the debugger.
Develop with pleasure!


