

Maintain The Same Code Quality Rules Across The Team With Qodana Code Analysis in PyCharm

PyCharm now bundles a plugin, which allows users to interact with analysis results delivered by Qodana – a new code quality platform from JetBrains. The platform is designed to bring server-side static analysis to your preferred CI tool. By using the same code inspections and profiles as PyCharm and other JetBrains IDEs do, Qodana helps ensure consistent code quality checks both in your IDE and your CI.

Qodana is ideal for development teams that want to increase cohesion and make sure that all their members apply the same rules to code quality checks. Qodana is also valuable for maintaining the quality of open-source projects and will remain free for the open-source community.
However you use Qodana, we believe it will prove invaluable for making your code more reliable, secure, and cleaner than ever before.
How to see Qodana results in PyCharm
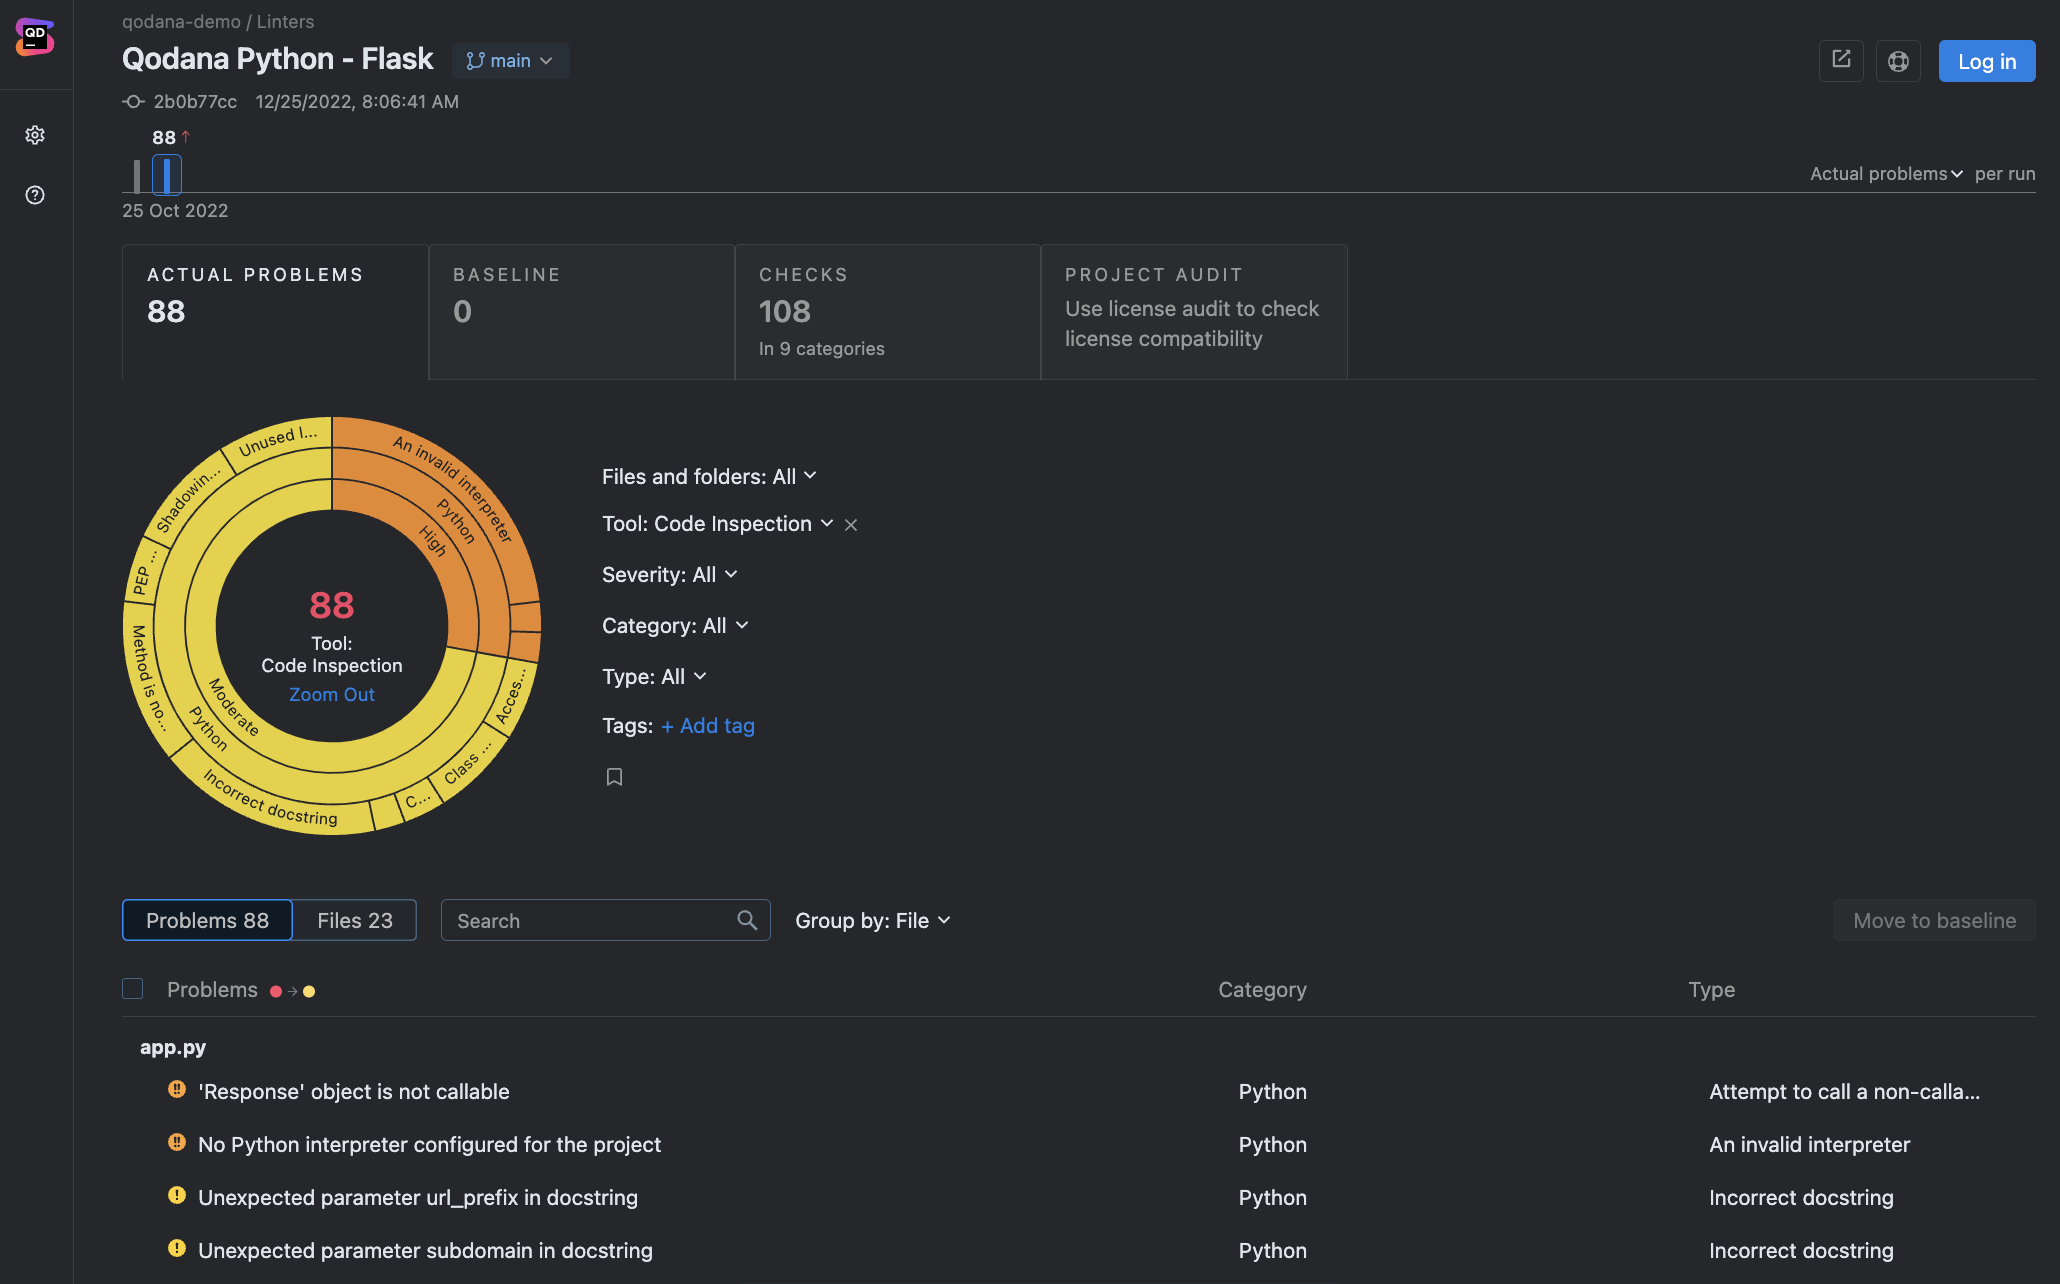
As PyCharm now bundles the Qodana IDE plugin, you can interact with Qodana results right in your IDE. The core plugin’s feature is loading the analysis results produced by the Qodana linter to the IDE and showing the detected issues in your project. After the results have been loaded, click on the Qodana tab in the Problems tool window to see an overview of the issues, and then navigate to the source code to fix them.
How to get Qodana results loaded in PyCharm
Before you can load Qodana results in the IDE, you should first get started with the platform and analyze your first project in one of the following ways:
- [Recommended] Trigger an analysis in Qodana Cloud by adding a token to your project in the CI platform.
OR
- Spin up the Qodana linter for Python as Docker.
Next, make sure that the analyzed project has also been opened in PyCharm to achieve a successful sync.
Once Qodana has scanned your first project, there are multiple ways to get Qodana results report loaded in your IDE:
Load the analysis results from Qodana Cloud. In the IDE, navigate to Tools | Qodana | Log in to Qodana. Then, link your IDE project with Qodana Cloud and get the Qodana report loaded in PyCharm.
Manually open a local SARIF file in the IDE. In the IDE, go to Tools | Qodana | Open Qodana Analysis report and select the qodana.sarif.json report file you would like to open.
Use the “Open in IDE” button from the Qodana UI. If you want to see a specific issue spotted by Qodana, simply click the “Open in IDE” button. The Toolbox App will open the IDE instance, and the IDE will spot the corresponding project and show you the problem.
In addition to scanning your code, you can use Qodana to set up quality gates, enforce project- and company-wide coding guidelines, better plan your refactoring projects, and perform holistic license audits. Get started with Qodana now!

Subscribe to PyCharm Blog updates


